ICICIBANK


ICICIBANK LONG INTRADAY 7 APR, 2021Dear trader,
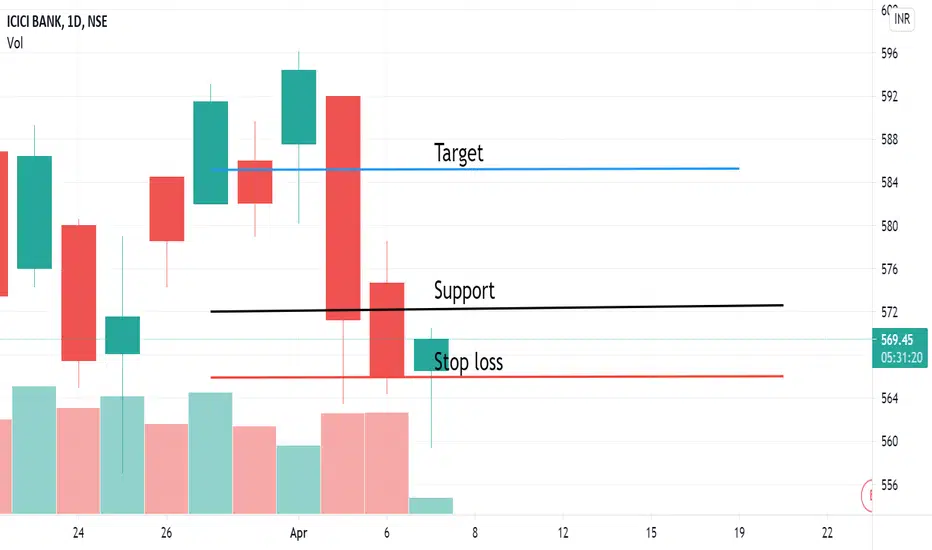
If u look at the chart of ICICIBANK (analysis based intraday only) the ICICIBANK Buy at 572 and Target at 585
Best Buy at 567.
Our Best Buy is based on high quality research and when the instrument reaches this level , it’s a jackpot trade.
Best Buy level might be executed or might not be executed.
The chart clearly indicates Bullish Trend you can also see the candle stick patters for more indepth analysis.
In Intraday most important thing is to enter and exit points.
Our signals are based on analytics, algorithms, mathematical derivatives.
Always be a responsible trader, kindly trade only when you have maximum opportunity in the market with minimum risk and with keynotes like data, analysis and proper strategies.
Kindly message us for strategies and analysis.


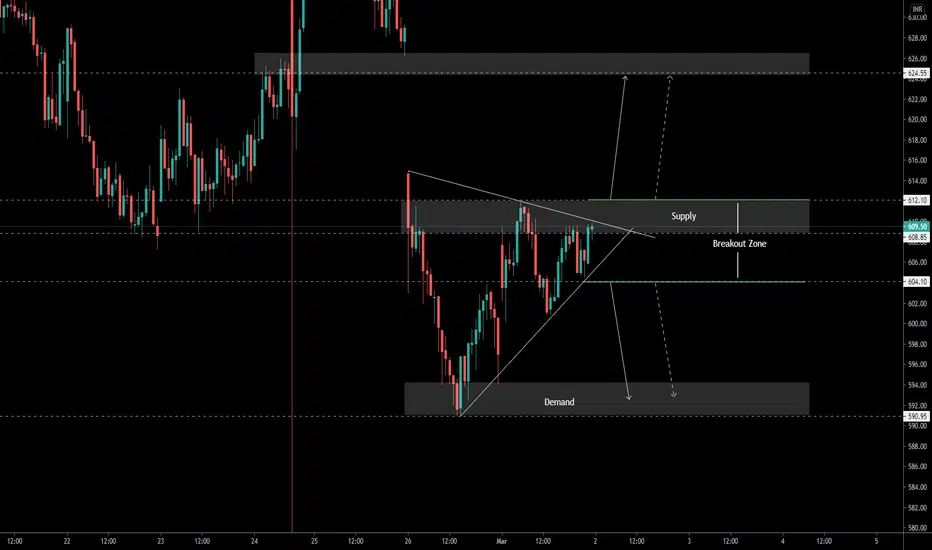
ICICI Falling Channel and BreakoutICICI Falling Channel and Breakout and closed above 50MA of VWAP. Bullish signal from here.


Going towards pivot support&fillup gapGoing towards pivot support & fillup gap.
Looks like good buy near Rs.550


ICICI Bank SHORTICICI on 1.414 FIB and near 2.618 projection
Rejection shows weakness
Short below 650 with 675 SL
Targets 610 and 600


ICICIBANK - Bull Flag Pattern breakout - SwingThis analysis is done purely on basis of price action and chart patterns
Analysis is done on Daily TF hence it may take few days to few weeks for price to reach the given target
Stock is has given volume supported breakout after good consolidation phase.
This is not a trade recommendation. Do your own study before entering into any trade.
Trade with your own risk & money management.
Feel Free to comment for any query or suggestion.
Do check other ideas based on similar pattern breakout. The link is below.

ICICI bank falling wedge patternICICI bank falling wedge pattern formed
high chances of breaking out of it if it sustains above 510
may break down below 500 for the marked area

ICICIBANK- I am not a market god to decide market movement even before market opens.
- I am Chart Pulse trader. I trade only what my chart speaks.


icici bank my positional view on ICICI BANK
Try Buy if you get 523
Sell around 576 - 596
Stop for sell 601
Targets 523 - 487

Short sell opportunity in ICICI BankCheck out weekly chart ^^
Kindly trade at your own risk.
Good Luck ^_^
