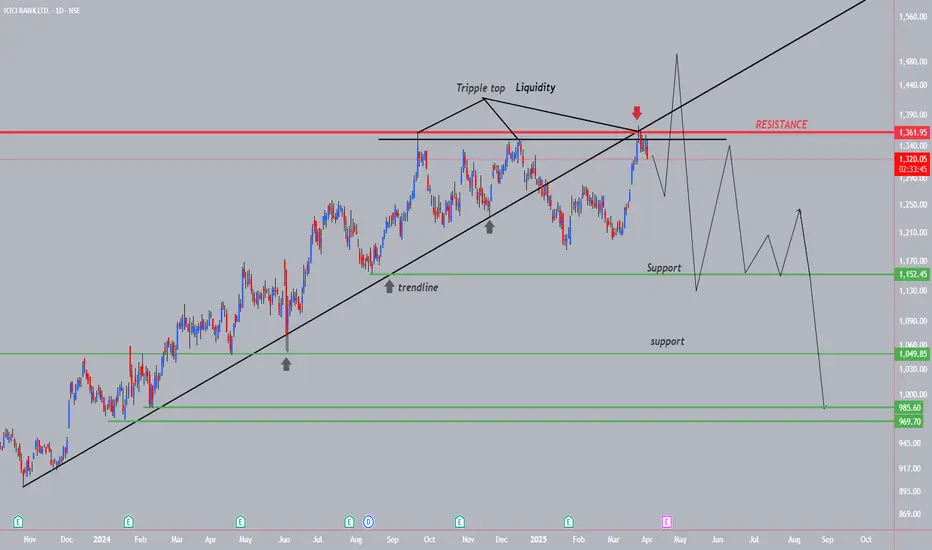
ICICIBANK--Tripple Top Liquidity+Down??This banking sector stock has broken the trendline strongly...
recently price taken the double top liquidity, creating an another liquidity....
do not make any attempt of short from this levels, still we don't have a sign of bearishness....
wait for one more liquidity on topside with strong upside move as exhaustion
then will observe a strong fall, after the liquidity...
then will go for short side...
on the bottom side we have a lot of trendline liquidity lies at support levels.
we have to look for buy at these levels for an investing point of view.
Icicibankanalysis
ICICI Bank Breaks Resistance on Solid Earnings – What's Next...?ICICI Bank has seen a notable increase of approximately 2.5% following a robust quarterly performance that exceeded market expectations. The bank reported a significant net profit uptick of 15%, amounting to ₹11,792.4 crore, reflecting its strategic initiatives' effectiveness. Additionally, its net interest income (NII) soared to ₹20,370 crore, driven by a healthy growth in lending and a favorable interest rate environment.
In a complementary move, the Reserve Bank of India (RBI) has unveiled a measure to infuse ₹1.5 lakh crore in liquidity into the financial system. This action is aimed at enhancing the overall liquidity conditions in the market and supporting economic activity.
Technically, the stock has successfully broken free from a downtrend that has been in place since December. It is now approaching a critical resistance level, which could be a pivotal point for future price movements. Should the stock manage to break through this resistance and sustain that position for a day or two, it could signal a strong buying opportunity for investors looking to capitalize on potential upside momentum. Hence, investors may want to consider initiating a long position or executing a purchase if these conditions are met.

icicibank for swing/poisitional
buy near 1210
avg at 1185-80
sl at 1160 sl 4% strictly follow sl
use capital 25k to 50 k
overall risk 1k to 2k only
tgt 4% 8%12%16%20%
hold 3-6 week

ICICI Bank Long Setup - Swing TradeICICI Bank has bullish engulfing setup and already 15m candle has sustained above the price - 1241.47 for more than 10 seconds.
Disclaimer: This is for educational purpose only and not any financial advice

ICICIBank Intraday Levels: 18-Sep-24Stock made high upto 1272, then sideways momentum in last trading session. Upside Breakout drag price for up, Trendline Breakout for down side momentum. Wait for prope Price Action on levels for Entry.
Bullish> 1273
Bearish < 1263

icici Bank channel support Long entryNSE:ICICIBANK icici Bank channel support Long entry above 1135 target 1170

ICICIBANK Intraday Levels: 24-Jun-24Stock closed near at Resistance Zone & Trendline support
Bullish > 1170
Bearish < 1150
Wait for proper rejections at zones, for entry add your strategy or indicator combination.

ICICIBANK--Continuation or Reversal??this stock is trading in a channel...
keep in long side until price is in the channel....
if channel breaks and retest then look for short side....
we have resistance in the zone1040-1050..
on bottom side trendline is acting as a support...if trendline breaks and retest then look for short side continuation. we have strong support lies at 960 levels.
Drop base drop chance...so keep an eye on this before long.

ICICIBANK - Bearish ViewICICIBANK - Elliott Wave Count
the market looks like its near the top and soon we can expect the reversal downside to Wave A correction.its recommended to wait for the price to comes back & close inside the channel to confirm the bearish scenario to take short trades. whatever the high made on wave 5 will be the SL for the short position.
Please note that this information is for educational purposes only, and it is crucial to trade with caution.
NSE:ICICIBANK NSE:ICICIBANKZ2023 BSE:ICICIBANK

ICICIBANK--Double Top??the stock is near its demand zone...
if price breaks this zone and gives retest will go for short side....
Chance of continuation fall till up to 920 zone...and then have a chance of Right shoulder formation...So keep in bearish view up to 920 and then look for buyside from this zone.

ICICIBANK--Near its trendline??the stock is near its trendline break...
today a strong bullish momentum is observed in this stock....
Rally base rally is observed from 965-962 zone...tomorrow if this zone acts as price is bullish...
this time will breaks the trendline and moves higher...
liquidity also lies above these zones....
Go for long in this stock...

ICICIBANK--Long to Bearish Gap ??The stock is trending downwards....
price is now near to a strong, a strong rise is observed from this area..
If it is a bullish turn price will take the support from this area... then look for buy side....
If this area pushes the price upside...we will on long side until the Bearish Gap be filled.
again will look for sell at Bearish Gap or trendline. Look for buy up to 970 and 980 levels.
Mean while it will also test the trendline again.
Keep safe.......

ICICI Bank is Retracing and can be Shorted 26/02/2021this tikker seems to me overvalued and retracing from its ATH, as we can see there are many reasons to believe this stock is falling and will correct some of its rally and make the infrastructure for its upcoming rally.
we can see there is a Mild Bearish Divergence on MACD and Regular Bearish Divergence on MACD Histogram, which are the sign of trend reversal and retracement.
MACD and Signal lines are over crossing from top which is again an other sign of overbought and shall distribute some volume which will cause the trend reversal and surplus of supply and price correction and fall.
as we can see the price was ranging in an ascending Paralel Channel and it has already tried to break above the top boundary but could not hold the bull run and fall drastically with Big Red Bearish Candles, which is again another confirmation for the Bearish Divergence and trend correction or retracement.
there are total of 3 TP for the retracement which are having confluences with Fibonacci retracement golden Zones 38.2%,48.6% 61.8% Levels, amd past Support areas.
obviously after this retracement we should look in to the market sentiment in order to decide about the longing or rebuying it but yet there are good chances that there would come some packages from the RBI to infuse some blood to the banks wanes and pump them back up and make the new ATH where it can be 127% and 161.8% of the same fibonacci expansions.
the other scenario after the retracement can be a renge and the fall more as we can see the Cryptocurrencies are growing heavily and of course their growth is very dangerous for the centralized banking system and soon these systems are going to loos the battle to the crypos if they don't adapt a survival mechanism on time for saving some time and loses and it can be an end if the prices fall below the red accumulation zone...
please comment you opinions about this analysis

ICICIBANK--Bulls Exhausted in this zone @950-960??The stock price is trending upwards it is said to be bullish again from 900 level,
Observe reaction at this level in lower time frames like in 15 min and enter long. price again wants to test the demand zone @ 910-900 range.
Price is facing Some resistance in the range 950-960 range.
if the price breaks 935 range gives some pullback enter for short.

ICICIBANK-Bullish The stock price is trending upwards it is said to be bullish again from 900 level,
Observe reaction at this level in lower time frames like in 15 min and enter long.
previously leaving an Supply zone, the same zone now acts as demand. price again came back to the same level,
enter here for long for the target of untested supply zone at 950-960 range.

ICICIBANK Buy Idea 11 May 2023 NSE:ICICIBANK is trading in a range. As per my analysis, if any 15 min candle closed and sustained above level of 942.00, it could be best opportunity to buy with stop loss of 925.
My expected upside target will be 973.00
Note: This is my personal analysis, only to learn stock market behavior. Thanks.

ICICI BANK: SHORT TERM TRADENSE:ICICIBANK bank short term Tarde. Lower band may be kept as SL and entry may considered on breakout/breakout retest.

Short ICICIFirst there was Bullish Gartley pattern that indicated an upward movement. Now the Bearish AB=CD is indicating a trend reversal and price should be around 730 in about 3 weeks.
In my opinion, a good time to short.
Stoploss point and Targets are mentioned on the chart.
If you have any questions, ask in the comments section.
Thanks.

ICICI Bank Short Term TradingLong above 864. T1 - 885, T2 - 907.75, T3 - 950, T4 - 992.15 ……. SL - 820
Short Below 778. T1 - 759, T2 - 745.05, T3 - 734, T4 - 694.50 ……. SL 802

ICICI BANK Trade setup Idea for 09 September, 2022ICICIBank is the first bank to reach its ATH, since 900 is a round level, I expect the stock to hover around the 900 levels for a day or 2 before it goes further higher.

ICICI Bank Levels for next weekDear traders, I have identified chart levels based on my analysis, major support and resistance levels. Please note that I am not a SEBI registered member. Information shared for educational purpose. Please do take trade based on your own analysis and risk-taking abilities. Never ever worked with fixed mindset. Any news/result data may change the direction of the trend instantly. Focus on learning so you can take correct/better decision based on your analytical skills. PLEASE NOTE THAT NO ONE CAN BE 100% CORRECT. OVERALL, WE SHOULD CONTINUE TO LEARN & BE ABLE TO CLOSE IN PROFIT EVEN IF WE ARE 50% CORRECT WITH RISK REWARD RATIO 1:2
ICICI Bank levels for next week. Bank Nifty is looking weak and traders as well as investors started doing profit booking. ICICI Bank is likely to offer sell on rise opportunity with SL (Candle closing on daily chart above life time high).
Have a happy, healthy & profitable day ahead!

ICICI Bank Future Chart LevelsDear traders, I have identified levels based on my analysis, major support and resistance levels. Please note that I am not a SEBI registered member. Information shared for educational purpose. Please do take trade based on your own analysis and risk-taking abilities. Never ever worked with fixed mindset. Any news/result data may change the direction of the trend instantly. Focus on learning so you can take correct/better decision based on your analytical skills. PLEASE NOTE THAT NO ONE CAN BE 100% CORRECT EXCEPT GOD. OVERALL, WE SHOULD BE ABLE TO CLOSE IN PROFIT EVEN IF WE ARE 50% CORRECT WITH RISK REWARD RATIO 1:2.
Is ICICI Bank ready to touch 52 High in coming days?
OR
Profit Booking will bring down ICICI Bank to near major support levels?

ICICI BANK | Get ready to go short.When it comes to the technical analysis of ICICI BANK, you might get an impulse to the downside. Based on my analysis, you might see a drop to the downside. If you are going in, better find a pullback. I have marked a good entry area on the chart; you may use it as an entry area. And also don't forget to place the stop just above the entry area.
What do you think is more likely to happen? Please share your thoughts in comment section. And also give a thumbs up if you find this idea helpful. Any feedback & suggestions would help in further improving the analysis.
If you find this technical analysis useful, please like & share our ideas with the community.
Good Luck!
Disclaimer!
This post does not provide financial advice. It is for educational purposes only! You can use the information from the post to make your own trading plan for the market. But you must do your own research and use it as the priority. Trading is risky, and it is not suitable for everyone. Only you can be responsible for your trading.
