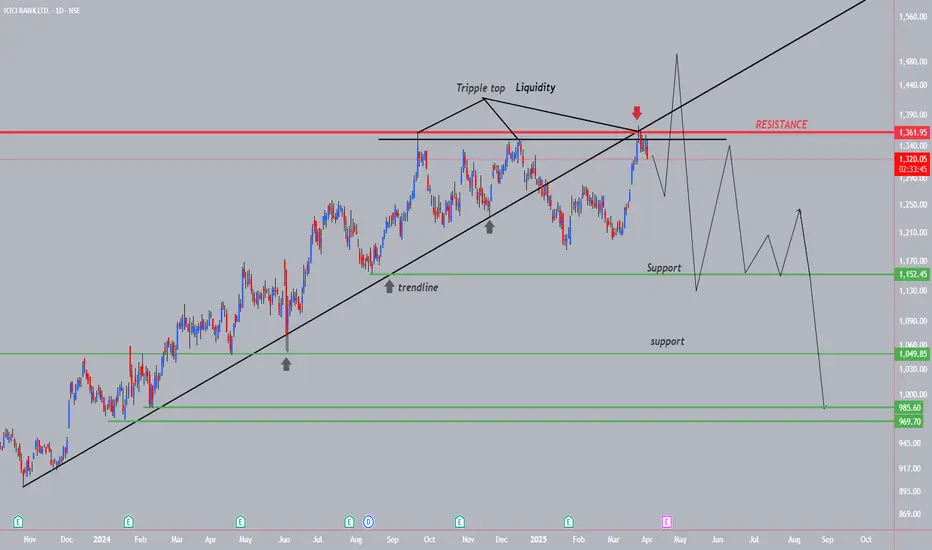
ICICIBANK--Tripple Top Liquidity+Down??This banking sector stock has broken the trendline strongly...
recently price taken the double top liquidity, creating an another liquidity....
do not make any attempt of short from this levels, still we don't have a sign of bearishness....
wait for one more liquidity on topside with strong upside move as exhaustion
then will observe a strong fall, after the liquidity...
then will go for short side...
on the bottom side we have a lot of trendline liquidity lies at support levels.
we have to look for buy at these levels for an investing point of view.
Icicibankshort
ICICIBANK Intraday Levels: 24-Jun-24Stock closed near at Resistance Zone & Trendline support
Bullish > 1170
Bearish < 1150
Wait for proper rejections at zones, for entry add your strategy or indicator combination.

ICICIBANK--Continuation or Reversal??this stock is trading in a channel...
keep in long side until price is in the channel....
if channel breaks and retest then look for short side....
we have resistance in the zone1040-1050..
on bottom side trendline is acting as a support...if trendline breaks and retest then look for short side continuation. we have strong support lies at 960 levels.
Drop base drop chance...so keep an eye on this before long.

ICICIBANK - Bearish ViewICICIBANK - Elliott Wave Count
the market looks like its near the top and soon we can expect the reversal downside to Wave A correction.its recommended to wait for the price to comes back & close inside the channel to confirm the bearish scenario to take short trades. whatever the high made on wave 5 will be the SL for the short position.
Please note that this information is for educational purposes only, and it is crucial to trade with caution.
NSE:ICICIBANK NSE:ICICIBANKZ2023 BSE:ICICIBANK

ICICIBANK--Double Top??the stock is near its demand zone...
if price breaks this zone and gives retest will go for short side....
Chance of continuation fall till up to 920 zone...and then have a chance of Right shoulder formation...So keep in bearish view up to 920 and then look for buyside from this zone.

ICICIBANK--Short Term Bearish look??Observations::
ICICIBANK:: from 960-880 bearish look
------Facing resistance in the zone 960...
buyers are exhausted in this zone....
from last few weeks it is trading in a zone....
the difference between the HH is reduced drastically and observed sellers are in control...
this may continue until price reached to 880 zone.
In the middle we have a demand zones, that will take the price up little bit.
Short term Bearish Look::
this is one more chance to enter for long to reach 1000, 1050 levels.
Keep track this levels, enter for long @880 or 860 zones.

ICICIBANK--Channel Breakout ??Observations:: NSE:ICICIBANK
------>>the stock is trending upwards in daily time frame.
---------->> now the price is trading @all time high
----------->> now we have to look at this stock ,If price breaks this resistance or not, if price breaks and resistance acts as support, we will observe new highs.
now the stock is looking weak in buy side, if it will sustain above 960 range we will observe some bullish momentum again.
if price breaks 960,and failed to sustain above 960 zone, we will go for selling. and previous supply zone acts as demand at 945 level. keep track this instrument.
we have demand zone @940 range, will acts as support.
If price breaks this level we will be on bearish side for the target of 925,915 range.
If more fall observed we have support @890-880 zone,
look here for long side.
Keep track this levels. Use alerts @ every place, we cannot track each and every stock daily, if you use alert system provided by trading view, which will alert you when the stock is near its demand or supply zone.
Use alert few points above demand or supply, you will aware when its coming towards your levels.

ICICIBANK--Bulls Exhausted in this zone @950-960??The stock price is trending upwards it is said to be bullish again from 900 level,
Observe reaction at this level in lower time frames like in 15 min and enter long. price again wants to test the demand zone @ 910-900 range.
Price is facing Some resistance in the range 950-960 range.
if the price breaks 935 range gives some pullback enter for short.

ICICI BANK - dump soonICICI BANK short position
The price has been traded in a rising wedge.
Expecting the breakout soon.
Target is shown on the chart

ICICIBANK KEY SUPPORT & RESISTANCE Here are major support and resistance of NSE:ICICIBANK for upcoming days. Recently ICICI Bank is at buy on dips strategy.
Note: This is my personal analysis, only for learning.

ICICI BANK 1D viewIcici bank follows the market trend and is almost near its strong support zone. Watch out for this level if it is unable to hold this level we can see a good fall in this stock as well.
Trade safe. Manage risk. Be profitable.
Please follow us for more simple trading analysis and setups. Also, let me know in the comment if you have any queries.
Disclaimer:- This is my view. Please analyze the charts yourself and then decide to take any trades.

Short ICICIFirst there was Bullish Gartley pattern that indicated an upward movement. Now the Bearish AB=CD is indicating a trend reversal and price should be around 730 in about 3 weeks.
In my opinion, a good time to short.
Stoploss point and Targets are mentioned on the chart.
If you have any questions, ask in the comments section.
Thanks.

ICICI Bank Short Term TradingLong above 864. T1 - 885, T2 - 907.75, T3 - 950, T4 - 992.15 ……. SL - 820
Short Below 778. T1 - 759, T2 - 745.05, T3 - 734, T4 - 694.50 ……. SL 802

ICICI Bank Levels for next weekDear traders, I have identified chart levels based on my analysis, major support and resistance levels. Please note that I am not a SEBI registered member. Information shared for educational purpose. Please do take trade based on your own analysis and risk-taking abilities. Never ever worked with fixed mindset. Any news/result data may change the direction of the trend instantly. Focus on learning so you can take correct/better decision based on your analytical skills. PLEASE NOTE THAT NO ONE CAN BE 100% CORRECT. OVERALL, WE SHOULD CONTINUE TO LEARN & BE ABLE TO CLOSE IN PROFIT EVEN IF WE ARE 50% CORRECT WITH RISK REWARD RATIO 1:2
ICICI Bank levels for next week. Bank Nifty is looking weak and traders as well as investors started doing profit booking. ICICI Bank is likely to offer sell on rise opportunity with SL (Candle closing on daily chart above life time high).
Have a happy, healthy & profitable day ahead!


ICICI BANK to fall further from current levelsEver since NSE:ICICIBANK hit the upper trendline in Upswing, its falling from there.
I see a Swing trade opportunity on SHORT side on ICICI BANK,
with SL at 732 and Target around 712.

Down Trend in ICICI BANK icici bank making double bottom on 15 min time frame. and if it breaking the previous day high go long and take the target on the horizontal line. and if icici bank look weak on that level this is the good time to go short on icicibank because it is a good pull back of down trend


ICICI Bank SHORTICICI on 1.414 FIB and near 2.618 projection
Rejection shows weakness
Short below 650 with 675 SL
Targets 610 and 600


icici bank my positional view on ICICI BANK
Try Buy if you get 523
Sell around 576 - 596
Stop for sell 601
Targets 523 - 487

ICICIBank Heikin Ashi Candles - on the way downIf you observe the last two days Heikin Ashi candles of ICICI Bank, both from hourly or daily candles, you can see that it has hit a classic Heikin Ashi red candle and the only way forward for the share is way down.

