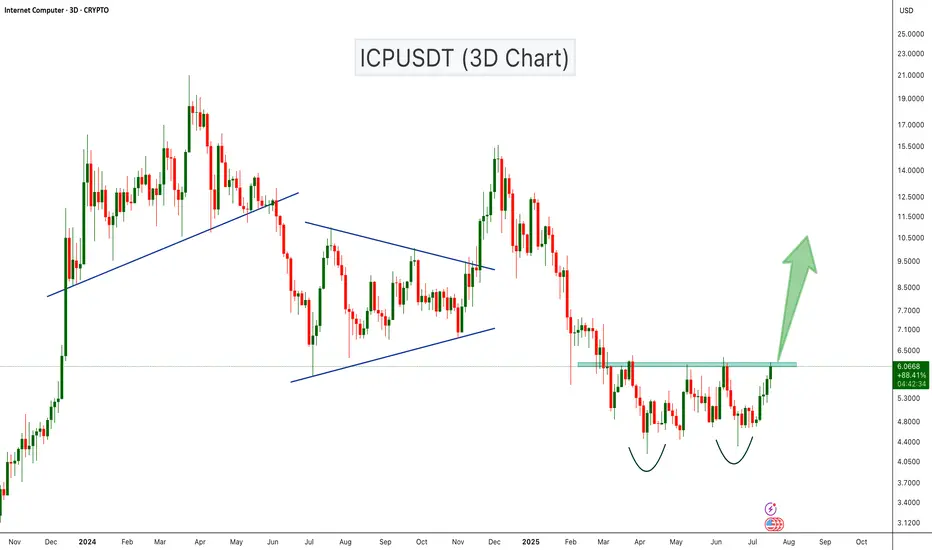
ICPUSDT Double Bottom Breakout Loading?ICPUSDT is showing a strong bullish setup with a classic double bottom pattern forming on the 3-day chart. The price has tested the support zone twice and is now approaching the neckline resistance around the $6.10 level. A confirmed breakout above this resistance could trigger a strong bullish move toward the next key resistance levels near $9.50 and $15.
Cheers
Hexa
ICP
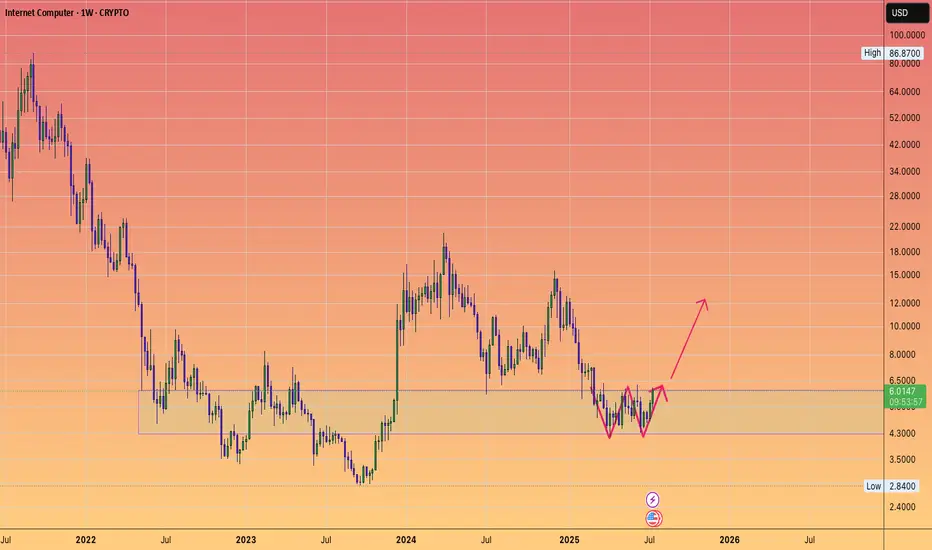
ICP still in the reload support zone....W pattern.
I like it down here.
Low risk accumulation block given the backdrop of #altseason going on.
Enjoy.
;)
ICP/USDT Weekly Analysis: Multi-Year Accumulation Base🔍 Macro Outlook & Context:
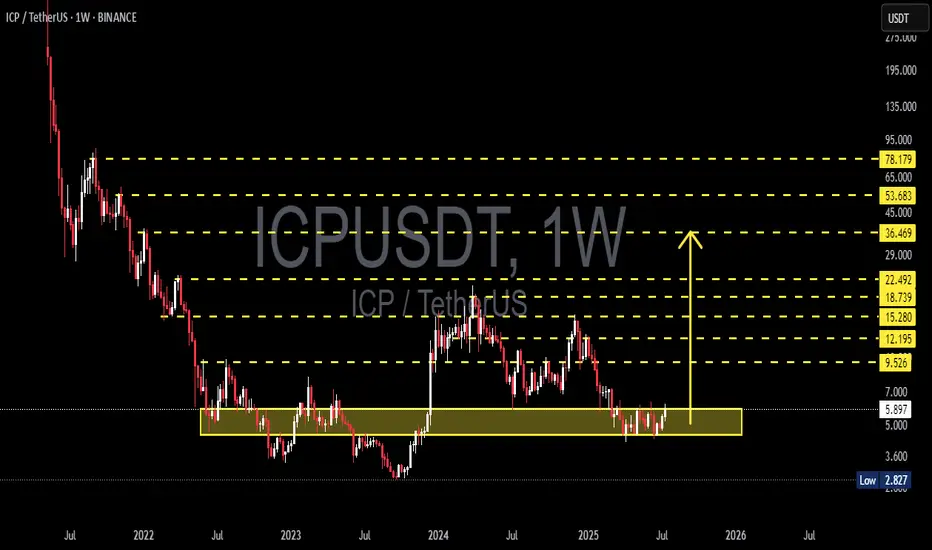
ICP has been in a prolonged downtrend since its initial listing, dropping over 95% from its all-time high. However, since late 2022, ICP has been forming a strong and well-defined accumulation base between the $3.00 – $6.00 range.
Currently, price action and structure indicate that a potential breakout from this multi-year base is imminent. The setup is beginning to mirror a Wyckoff Accumulation Phase, where smart money accumulates quietly before launching into the next markup phase.
📐 Technical Structure & Pattern Breakdown:
✅ Accumulation Zone
Over 80 weeks of consolidation within a tight horizontal range.
This forms a strong foundation for a powerful breakout move if confirmed.
✅ Multiple Bottom Formation
Repeated failures to break below $3.50 suggest growing bullish pressure and seller exhaustion.
✅ Bullish Compression
Higher lows forming inside the range.
Resistance at $6.00 is being tested more frequently, indicating a breakout buildup.
✅ Volume Profile
Declining volume during sideways action = typical of supply exhaustion.
Surge in volume during breakout would confirm entry into markup phase.
🚀 Bullish Scenario (Primary Setup):
If price breaks and closes above $6.00 on the weekly timeframe:
Key Resistance Targets:
$9.52 → $12.19 → $15.28 → $18.73 → $22.49
Extended Bull Market Targets:
$29 → $36 → $45+
Potential ROI from base zone: +200% to +600%
Bullish Confirmation Signals:
Strong weekly candle close above $6.00
Volume breakout
RSI crossing 50 and MACD bullish crossover
🐻 Bearish Scenario (Alternative):
If the breakout fails and rejection occurs at $6.00:
Possible retracement back to lower support zones:
$4.50 → $3.00
A breakdown below $3.00 would invalidate the bullish structure and open risk for new lows.
Bearish Red Flags:
Long upper wick near resistance without volume
RSI drops back under 40
Breakdown of $3.50–$4.00 support zone
📊 Trading Strategy & Risk Management:
Entry Type Price Range
Breakout Entry $6.20–$6.50
Conservative SL $5.20
Aggressive SL $4.70
TP Range $9.5 to $22.4
Long-Term TP Up to $45+
Use scaled take-profits to secure gains gradually and reduce risk.
🧠 Market Sentiment & Psychology:
Sentiment is slowly shifting from fear to anticipation. Long-term accumulators and institutional players often target setups like this — low prices with solid structure and untapped upside. If breakout confirms, ICP could become one of the top-performing altcoins of the next cycle.
> “Accumulation is where smart money buys. Breakout is where the public chases.”
📌 Final Thoughts:
ICP/USDT is at its most critical point in over two years. A confirmed breakout from this long-standing base could be the launchpad for a multi-stage rally. This is a setup worth watching closely — or acting on with tight risk control.
#ICPUSDT #CryptoBreakout #AltcoinAnalysis #TechnicalAnalysis #WyckoffAccumulation #LongTermSetup #CryptoReversal #BullishCrypto #ICPAnalysis #AltcoinSeason #BreakoutTrade #Cryptocurrency
TradeCityPro | ICP Eyes Breakout as Altseason Speculation Grows 👋 Welcome to TradeCity Pro!
In this analysis, I want to review the ICP coin for you—one of the DePIN and AI-related coins, ranked 37 on CoinMarketCap with a market cap of 3.11 billion.
📅 Daily timeframe
As you can see on the daily timeframe, a ranging box has formed around the key support at 4.648, and price is fluctuating inside this box.
🔔 The top of the box is at 6.205, and price has touched it multiple times. It just wicked into it again and got rejected.
📈 This level has become a very important resistance. If it breaks, we can enter a long position—and it’s even suitable for a spot buy.
🛒 I already hold this coin in spot from lower entry points and don’t plan to increase my spot volume, but I’ll open a futures position if 6.205 breaks.
🔽 If Bitcoin Dominance moves downward, the 6.205 trigger will be a very good entry point. A break above 70 on the RSI will also be a strong momentum confirmation.
📊 If price gets rejected from the top of the box and drops to the 4.648 support, we can open a short position in lower timeframes. A break below 4.648 would confirm the bearish outlook.
📝 Final Thoughts
This analysis reflects our opinions and is not financial advice.
Share your thoughts in the comments, and don’t forget to share this analysis with your friends! ❤️

ICP to mark up for a higher highBYBIT:ICPUSDT.P looks like accumulating around $5 and can hit $8 in the coming days. There needs to be an increasing momentum soon.

ICP INTERNET COMPUTER PROTOCOLTilt your head a little to the left — and you’ll see it all.
We’re currently in the accumulation zone, the phase of position building.
Future price targets are already mapped out on the chart.
All ideas are shared strictly for spot trading — no futures involved!


ICPUSDT 1W AnalysisICP ~ 1W Analysis
#ICP If you still have confidence in this coin, maybe you can consider this support to start buying back from here, with a short-term target of at least 15%++

#ICP/USDT#ICP
The price is moving within a descending channel on the 1-hour frame, adhering well to it, and is heading towards a strong breakout and retest.
We are experiencing a rebound from the lower boundary of the descending channel, which is support at 5.85.
We are experiencing a downtrend on the RSI indicator that is about to be broken and retested, supporting the upward trend.
We are heading towards stability above the 100 Moving Average.
Entry price: 6.04
First target: 6.13
Second target: 6.28
Third target: 6.50

TradeCityPro | ICP Approaches Key Resistance with Rising Volume👋 Welcome to TradeCity Pro
In this analysis, I want to review the ICP coin for you. The Internet Computer project operates in the fields of artificial intelligence and DePIN.
⭐ The coin of this project, with the symbol ICP, has a market cap of 3.25 billion dollars and ranks 32nd on CoinMarketCap.
📅 Daily Timeframe
As you can see in the daily timeframe, there is a descending trendline visible on the chart, which has been tested multiple times. The price has broken above it and is now sitting just below the 6.205 resistance level.
🔍 In recent candles, the volume has increased significantly, which raises the likelihood of a breakout above 6.205.
🔔 If the 6.205 level is broken, ICP's bullish trend could begin. In that case, the price could move toward the 7.423 and 9.887 levels.
📊 Entering a position with the breakout of 6.205 is supported by volume confirmation, and we will get RSI momentum confirmation if it enters the overbought zone.
📉 For the bearish scenario to play out, the price must first get rejected from 6.205, and then we’ll look for confirmation of a trend reversal with a break below 4.468.
🛒 You can also use this same 6.205 trigger for a spot buy, but keep in mind that Bitcoin dominance is still in an uptrend, so in my opinion, it’s not yet the right time to buy altcoins.
✔️ The best trigger for buying any altcoin is to wait for confirmation of a trend reversal in Bitcoin dominance. Once that’s confirmed, you can start buying the altcoins you’ve selected.
📝 Final Thoughts
This analysis reflects our opinions and is not financial advice.
Share your thoughts in the comments, and don’t forget to share this analysis with your friends! ❤️

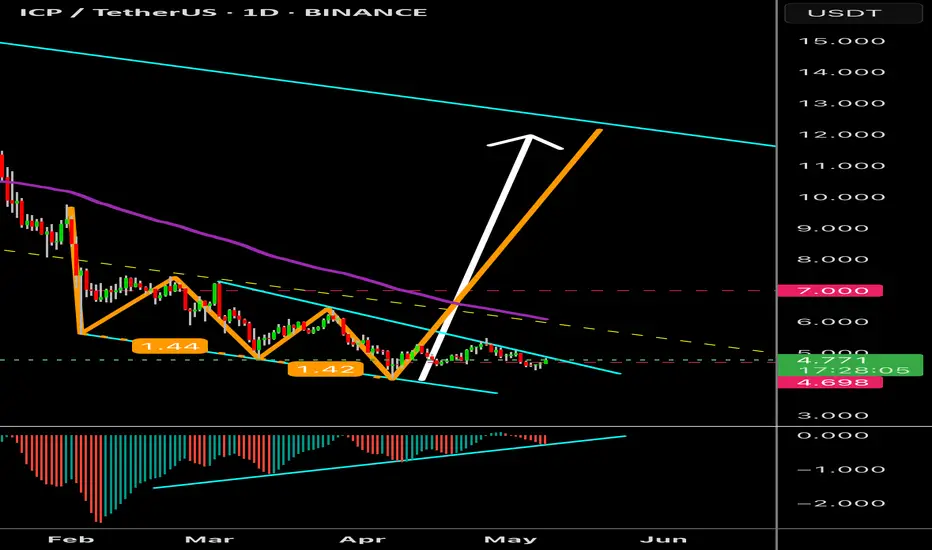
Internet Computer Protocol $81 Easy Target Yields 1,450% ProfitsIf you saw the Injective chart you know what happens after a correction, a classic ABC correction. What follows a correction is a bullish impulse.
A target of $81 gives us more than 1,450% profits potential for this pair, ICPUSDT (Internet Computer Protocol).
This is a project that was damaged by the SEC's decision to label it a security, remember? The SEC today is no longer the same as back in those days. It is different now. The SEC is crypto-bullish, the SEC is friendly and whatever damage was caused will be reversed, make no mistake.
Right now ICP is moving within it's long-term accumulation zone. As the name implies, a zone that is good to buy for those focused on long-term hold. Even if you are looking at the short-term or mid-term, this right now is a great entry, great timing, the best possible prices preceding the 2025 bull market phase.
It was a while back when I first saw the possibility of the bull market extending beyond late 2025. This scenario/possibility is now becoming stronger with many projects supporting this view. The chart of many stable, long-term projects are pointing to growth leading into the first half of 2026. Q1 and Q2 2026. This would definitely be the best ever.
Will the next bull market peak in late 2025 or early 2026? Make your guess. What cannot be doubted is that we are going up next. Up, up, up. Are you prepared?
Preparation comes in the form of a plan, and lots of money injected into the market. Buy like the world is about to end. Start buying and continued buying, everything you can. You will be very happy with the results, I promise.
Thank you for reading.
Namaste.

ICP - Perfect Long OpportunityDescription
---------------------------------------------------------------
+ ICP has started reversal inside the channel and the price is heading towards the resistance zone, this gives a bullish trade opportunity.
---------------------------------------------------------------
VectorAlgo Trade Details
------------------------------
Entry Price: 5.3
Stop Loss: 3.3
------------------------------
Target 1: 6.9
Target 2: 12.7
Target 3: 22.5
------------------------------
Timeframe: 1W
Capital Risk: 1-2% of trading amount
Leverage: 5-10x
---------------------------------------------------------------
Enhance, Trade, Grow
---------------------------------------------------------------
Feel free to share your thoughts and insights. Don't forget to like and follow us for more trading ideas and discussions.
Best Regards,
VectorAlgo

ICPUSDT 1D AnalysisICP ~ 1D Analysis
#ICP Buy gradually from here if you still have confidence in this coin with a short term target of at least 10%+ from here.

The Bullish Case of ICP#ICP started a strong bullish motive wave back in Sep 2023, followed by a clear corrective structure.
The recent bounce from a key Fib extension level and the positive weekly indicators support this bullish outlook.
Breaking $4.50 is the stop-loss.
#InternetComputer

$ICP: Internet Computercup and handle on the weekly timeframe with a trend line breakout, double retest, oversold rsi, and bullish looking mac d. do whatever you like with this information. not financial advice, gaming advice 🎮
CRYPTOCAP:ICP
BINANCE:ICPUSDT
COINBASE:ICPUSD
BINANCE:ICPUSD

Potential Bullish 3 drive pattern in action We might see the results of a potential bullish 3 drive pattern, confirmation can be when price action breaks resistance of pattern, and support holds! Bullish divergence!
ICP / USDT: In the Macro Support Zone
The price has reached the target macro support zone for the formation of a long-term bottom.
As long as the price stays above the April 7th lows, my main scenario is that the macro correction (wave (2)) has ended and a new multi-year growth cycle has begun.
Weekly Projection:
Thank you for your attention and I wish you successful trading decisions!
Previous ideas on ICP :
Nov'24:
Jun'24:
Dec'23:

Internet Computer (ICP)ICP project was announced with great fanfare and promised great features. However, ICP's price was in a long downtrend until recently when price broke the downtrend line and made a higher high and a higher low. It's too soon to surmise the major trend reversal has happened since at least another higher high and higher low is needed. Let's see what happens.

TradeCityPro | ICP: Breakout Watch in Web3 Veteran’s Price Range👋 Welcome to TradeCity Pro!
In this analysis, I’m going to review the ICP coin for you. The Internet Computer project is one of the older projects in the crypto space, focused on Web3 and gaming.
⚡️ The coin currently has a market cap of $2.65 billion, placing it at rank 36 on CoinMarketCap.
⏳ 4-Hour Timeframe
As you can see in the 4-hour timeframe, a range box has formed between the levels of 4.648 and 5.239, and the price has currently reached the top of the range.
✔️ During this upward leg from the bottom of the box, market volume has been increasing, which indicates that the probability of breaking through 5.239 is high.
🔍 If 5.239 is broken, we can enter a long position. The next resistance levels are at 5.558 and 6.313.
✨ There’s also a larger range box between 4.648 and 6.313, and as long as the price stays above 4.648, we can say that this broader range is valid and price is fluctuating within it.
📉 To open a short position, wait for the break of 4.648. The momentum in higher timeframes for this coin is bearish, so if this level breaks, the trend may continue downward with another leg to the downside.
📊 For that to happen, selling volume must increase, so that when 4.648 breaks, there is no volume divergence, ensuring a healthy continuation of the trend.
📝 Final Thoughts
This analysis reflects our opinions and is not financial advice.
Share your thoughts in the comments, and don’t forget to share this analysis with your friends! ❤️

ICPUSDT 1D AnalysisICP ~ 1D Analysis
#ICP Buy gradually after successfully breaking through this resistance line, with a short-term target of at least 10% gain.

ICP: The Complicated Correction#ICP has seen a complicated decline since March 2024. As long as it holds above $2.84, this bearish trend remains as a corrective wave.
Passing $15.59 confirms a shift in trend toward higher targets.
#InternetComputer

ICP Is Bearish For MidTerm (3D)On the chart, it appears that we have a large-degree ABC structure, where Wave B formed a triangle and has now completed.
Wave C should take more time than Wave A. Since Wave B has retraced 0.382% of Wave A, it is expected that Wave C will also be deep
We have marked the price and time boxes on the chart.
A daily candle closing above the invalidation level will invalidate this analysis
For risk management, please don't forget stop loss and capital management
Comment if you have any questions
Thank You

$ICP falling wedge, potentially the start of bullish rallyIf price action breaks falling wedge upwards, we might see the start of the bullish season.
Ivan B.
