BTCUSD: Bulls Are Winning! Long!
My dear friends,
Today we will analyse BTCUSD together☺️
The recent price action suggests a shift in mid-term momentum. A break above the current local range around 105,670.43 will confirm the new direction upwards with the target being the next key level of 106,057.41 and a reconvened placement of a stop-loss beyond the range.
❤️Sending you lots of Love and Hugs❤️
Ict

ETHUSD: Next Move Is Down! Short!
My dear friends,
Today we will analyse ETHUSD together☺️
The market is at an inflection zone and price has now reached an area around 2,545.9 where previous reversals or breakouts have occurred.And a price reaction that we are seeing on multiple timeframes here could signal the next move down so we can enter on confirmation, and target the next key level of 2,529.4..Stop-loss is recommended beyond the inflection zone.
❤️Sending you lots of Love and Hugs❤️

NATGAS Growth Ahead! Buy!
Hello,Traders!
NATGAS made a retest of
The horizontal support level
Of 3.450$ then established
A double bottom pattern
And a we are already
Seeing some rebound so
We are locally bullish biased
And we will be expecting a
Further bullish move up
On Monday
Buy!
Comment and subscribe to help us grow!
Check out other forecasts below too!
Disclosure: I am part of Trade Nation's Influencer program and receive a monthly fee for using their TradingView charts in my analysis.


TESLA WILL GO DOWN|SHORT|
✅TESLA is going up now
But a strong resistance level is ahead at 336$
Thus I am expecting a pullback
And a move down towards the target of 320$
SHORT🔥
✅Like and subscribe to never miss a new idea!✅
Disclosure: I am part of Trade Nation's Influencer program and receive a monthly fee for using their TradingView charts in my analysis.


CAD_CHF SHORT FROM RESISTANCE|
✅CAD_CHF has retested a key resistance level of 0.5990
And as the pair is already making a bearish pullback
A move down to retest the demand level below at 0.5960 is likely
SHORT🔥
✅Like and subscribe to never miss a new idea!✅
Disclosure: I am part of Trade Nation's Influencer program and receive a monthly fee for using their TradingView charts in my analysis.

NZD-CAD Free Signal! Buy!
Hello,Traders!
NZD-CAD is about to retest
A horizontal support level
Of 0.8161 from where we
Will be expecting a local
Bullish rebound so we can
Enter a long trade with the
Take Profit of 0.8191 and
The Stop Loss of 0.8153
Buy!
Comment and subscribe to help us grow!
Check out other forecasts below too!
Disclosure: I am part of Trade Nation's Influencer program and receive a monthly fee for using their TradingView charts in my analysis.

NG1!: Target Is Down! Short!
My dear friends,
Today we will analyse NG1! together☺️
The price is near a wide key level
and the pair is approaching a significant decision level of 3.602 Therefore, a strong bearish reaction here could determine the next move down.We will watch for a confirmation candle, and then target the next key level of 3.569..Recommend Stop-loss is beyond the current level.
❤️Sending you lots of Love and Hugs❤️

USOIL: Absolute Price Collapse Ahead! Short!
My dear friends,
Today we will analyse USOIL together☺️
The recent price action suggests a shift in mid-term momentum. A break below the current local range around 73.387 will confirm the new direction downwards with the target being the next key level of 72.481.and a reconvened placement of a stop-loss beyond the range.
❤️Sending you lots of Love and Hugs❤️

NI225: Will Go Up! Long!
My dear friends,
Today we will analyse NI225 together☺️
The in-trend continuation seems likely as the current long-term trend appears to be strong, and price is holding above a key level of 37,817.93 So a bullish continuation seems plausible, targeting the next high. We should enter on confirmation, and place a stop-loss beyond the recent swing level.
❤️Sending you lots of Love and Hugs❤️

EUR/USD Bulls in Control... But the Trap Is Set at 1.1600? 🇺🇸 EUR/USD – Technical & Macro Outlook
EUR/USD has posted an impressive rally over the past few weeks, driven by a combination of technical and macro factors. It is currently trading around 1.1586, right at the edge of a major supply zone where previous sharp rejections and reversals have taken place.
🔍 Technical Analysis
Price action remains within a well-defined ascending channel that began in mid-April, fueling the bullish move from the 1.07 lows.
The current daily candle is showing signs of exhaustion within the 1.1550–1.1600 resistance zone, with upper wicks and declining volume.
RSI is in a high-neutral zone but not yet overbought, leaving room for more upside — but also increasing the probability of a technical pullback.
🔁 Key Levels:
Primary resistance: 1.1600 (multi-touch supply area)
Support 1: 1.1460–1.1430 (previous resistance, now potential support)
Support 2: 1.1300–1.1270 (demand zone + channel base)
📉 COT Report – June 3, 2025
Non-Commercials (speculators) remain net-long with over 200,000 contracts, though both long (-1,540) and short (-4,830) positions saw reductions. This suggests a bullish structure with early signs of profit-taking.
Commercials are heavily net-short, with 575,000 short contracts versus 437,000 long — a structurally bearish stance from physical market participants.
Open interest increased significantly by +20,813, pointing to renewed speculative participation and potential volatility.
🧭 Retail Sentiment
Retail traders are heavily short (80%) with an average entry around 1.1253.
This contrarian behavior is typically supportive of continued upside pressure — especially if price holds above key supports.
📅 Seasonality – June
Historical averages over 10, 15, and 20 years show a slightly bullish tendency in June.
The 2- and 5-year patterns suggest more neutral to mildly bearish behavior.
This supports a consolidation or corrective pullback, without ruling out higher moves during the summer rally.
🎯 Trading Conclusion
Current bias: Moderately bullish, with rising pullback risks near 1.1600
Possible setup: Tactical short between 1.1580–1.1610 if confirmed by bearish price action
Target: 1.1430–1.1300
Bullish scenario remains valid unless we break below 1.1270
📌 Summary
The bullish trend is strong but technically extended. Speculative positions remain net-long but are starting to unwind. The retail crowd is still betting against the move, which favors bulls. However, structural resistance calls for caution — a pullback could be imminent.

Massive GBP/USD Reversal Ahead? Head & Shoulders FormationGBP/USD is at a critical technical juncture following a sharp bullish impulse that pushed the pair above the 1.34 handle, printing a strong weekly bullish engulfing candle and breaking out of a multi-week consolidation zone. This move unfolded in a macro context where the U.S. Dollar Index (DXY) is showing clear signs of weakness, with Non-Commercial net long positions dropping drastically—from around 20,000 to less than 5,000 contracts. This shift points to a fading speculative appetite for the dollar, historically a leading indicator of upcoming corrective phases or broader declines in the DXY.
On the flip side, the Commitments of Traders (COT) report on the British Pound reveals that Non-Commercials (typically hedge funds and asset managers) remain net long on GBP, with a slight increase week-over-week. However, Commercials (generally institutions and hedgers) have aggressively built up a significant net short position—levels that in the past preceded major reversals on the pair. This divergence between speculators and institutional hedgers suggests short-term bullish potential, but with rising risk of exhaustion near current resistance levels.
Adding fuel to this outlook is the retail sentiment: approximately 63% of retail traders are currently short GBP/USD, with an average entry price around 1.3021. This kind of retail crowd positioning, typically inefficient from a historical perspective, adds contrarian support for further upside, as long as price holds above the 1.3340 structure.
From a seasonality perspective, June tends to be a mildly bullish-to-sideways month for GBP/USD, especially when looking at the 10- and 15-year seasonal averages. While the seasonal bias is not particularly strong, there’s also no statistical downward pressure this time of year, leaving room for technically-driven moves influenced by liquidity and sentiment rather than macro patterns alone.
On the technical front, the daily chart shows a steep rally capped by a large green candle on Monday, breaking cleanly through the 1.34 resistance zone. The price is now hovering inside a key supply area between 1.3499 and 1.3550—a historically reactive zone that has triggered major rejections in previous months. How price reacts here will likely shape the next major swing. A confirmed breakout and consolidation above 1.3550 would open the door for an extension toward 1.37–1.3750. Conversely, a sharp rejection followed by a break below 1.3412—and especially under 1.3340—would set the stage for a deeper correction toward 1.3170.
The RSI is currently showing early signs of momentum loss, although no strong bearish divergence has emerged yet. This implies that the pair could still fuel another push higher before running out of steam—possibly forming the right shoulder of a head & shoulders pattern if the rejection scenario plays out.

GBPJPY At the Top? Massive Liquidity Grab📈 1. Price Action & Key Technical Levels (Daily Chart)
Price reached a major supply zone between 196.0 and 197.0, showing clear rejection (weekly pin bar and a lower high structure relative to the previous peak).
The long-term descending trendline acted as resistance again.
A confirmed rising wedge pattern broke to the downside, with first target around 191.4, and extended target near 187.4 (key demand zone with historical confluence).
Weekly RSI shows a bearish divergence vs price highs – an additional signal of bullish exhaustion.
📊 2. COT Data (as of June 3, 2025)
GBP (British Pound)
Net long positions increased by +30,371 contracts (Commercial + Non-Commercial).
Non-Commercials: 103,672 long vs 68,457 short → net long +35,215 but the increase is relatively modest.
Commercials are increasing both long and short positions, but the net delta supports medium-term GBP resilience.
JPY (Japanese Yen)
Net short worsened by -13,566 contracts.
Non-Commercials are cutting longs and adding shorts → aggressive yen selling.
Commercials remain heavily short (275,659 vs 100,151 long).
➡️ COT Conclusion: GBP remains structurally strong, but the JPY is now extremely oversold, increasing the likelihood of a technical correction in favor of JPY (GBPJPY pullback).
📉 3. Retail Sentiment
72% of retail traders are short GBPJPY, with an average entry at 191.2.
Current price is above 195.8 → a liquidity sweep above retail shorts may have already occurred.
The order book shows a heavy sell cluster between 195.0–195.9 → potential zone of manipulation/liquidation.
➡️ Contrarian view: After sweeping liquidity above retail highs, we may now see downside pressure to clean out breakout longs.
📅 4. Seasonality
June tends to be neutral to bearish:
5-year average: +0.45% (weak gain)
10- and 15-year averages: -1.24% and -1.30%
Historically, the first 10 days of June often mark a local top, followed by a decline – consistent with the current price structure.
🧠 5. Macro-Technical Confluence
The broader setup points to a distribution phase between 195.5–196.5, with high probability of a technical pullback toward 193.5–191.4 in the short-to-medium term.
The yen's oversold conditions may ease temporarily, supporting a corrective GBPJPY retracement.
Break below 193.5 would confirm the move toward 191.4 and eventually 187.4 – an area of institutional interest.
🔍 Trade Setup Summary (Bias: Bearish)
Technical context: Short setup confirmed by structure break, divergence, and supply rejection.
Macro/sentiment context: Supports a corrective pullback on the pair.
Strategy: Look for intraday weakness below 195.0–194.5 → targeting 193.5, then 191.4.
Invalidation: Daily/weekly close above 197.0.

NQ100 → Entering the Danger Zone?📈 1. Technical Context (Price Action & Structure)
The daily chart shows a strong bullish continuation from the 17,350 area, with price now extending toward the 22,000 USD zone.
We are currently within a weekly/monthly supply, with:
Mild RSI divergence in overbought conditions
Temporary rejection at 22,050–22,200
A potential liquidity sweep above highs before distribution or pullback
The monthly structure shows a strong swing low that may serve as anchor for a future reversal
🧠 2. COT Report – Commitment of Traders (as of June 3)
Commercials (Smart Money):
+4,041 long | +3,320 short → Net +1,455 → hedging phase, not trend expansion
Non-Commercials (Speculators):
–2,237 long | +125 short → net exposure reduction
Open Interest increasing → new positions building, but no extreme imbalance
📌 Conclusion: Tactical neutrality, slight bullish lean from commercials.
📆 3. Seasonality
June has been historically bullish, especially in the past 2 years (+700 pts avg)
10Y average still leans bullish
⚠️ September is a clear seasonal reversal month across all timeframes
📌 Conclusion: Seasonal tailwind through end of June; cyclic reversal risk into Q3.
📰 4. Macro Calendar
High-impact USD week:
CPI – Wed, June 11
PPI – Thu, June 12
These will be critical to:
Validate the disinflation narrative
Set expectations for a Fed cut by Sep/Nov
📌 Conclusion: Expect explosive mid-week volatility — watch for liquidity spikes above 22,000 if CPI surprises.
⚙️ Operational Outlook
✅ Primary scenario (bullish continuation):
🎯 Target: 22,260 → fib extension + structure
❌ Invalid below 21,350
🔄 Alternative scenario (mean reversion):
🔻 Short from 22,050–22,200
🎯 Target: 20,950 → liquidity + FVG zone
🔁 Trigger: weekly engulf or hotter-than-expected CPI

AUD_CHF LOCAL SHORT|
✅AUD_CHF has retested a resistance level of 0.5290
And we are seeing a bearish reaction
With the price going down but we need
To wait for a confirmation
Before entering the trade, so that we
Get a higher success probability of the trade
SHORT🔥
✅Like and subscribe to never miss a new idea!✅
Disclosure: I am part of Trade Nation's Influencer program and receive a monthly fee for using their TradingView charts in my analysis.

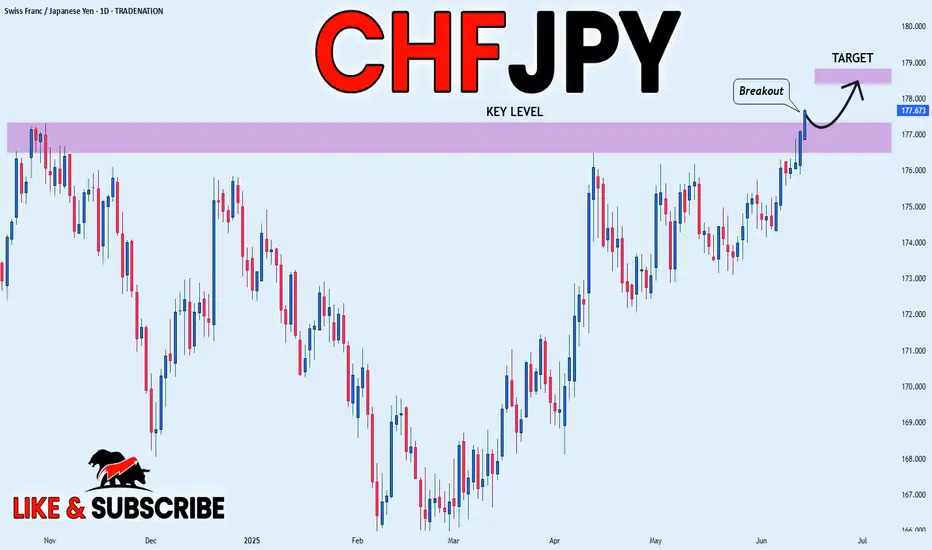
CHF_JPY BULLISH BREAKOUT|LONG|
✅CHF_JPY is going up
Now and the pair made a bullish
Breakout of the key horizontal
Level of 177.000 and the breakout
Is confirmed so we are bullish
Biased and we will be expecting
A further bullish move up
On Monday
LONG🚀
✅Like and subscribe to never miss a new idea!✅
Disclosure: I am part of Trade Nation's Influencer program and receive a monthly fee for using their TradingView charts in my analysis.
AUD-JPY Will Go Down! Sell!
Hello,Traders!
AUD-JPY made a retest
A wide horizontal resistance
Around 93.900 from where
We are already seeing a
Local bearish pullback so
We will be expecting
A further bearish move
Down on Monday
Sell!
Comment and subscribe to help us grow!
Check out other forecasts below too!
Disclosure: I am part of Trade Nation's Influencer program and receive a monthly fee for using their TradingView charts in my analysis.

CAD-JPY Free Signal! Sell!
Hello,Traders!
CAD-JPY went up sharply
But the pair failed to break
A strong horizontal resistance
Of 106.266 from where we
Can enter a short trade with
The Take Profit of 105.768
And the Stop Loss of 106.326
Sell!
Comment and subscribe to help us grow!
Check out other forecasts below too!
Disclosure: I am part of Trade Nation's Influencer program and receive a monthly fee for using their TradingView charts in my analysis.

DXY: Local Bullish Bias! Long!
My dear friends,
Today we will analyse DXY together☺️
The market is at an inflection zone and price has now reached an area around 97.757 where previous reversals or breakouts have occurred.And a price reaction that we are seeing on multiple timeframes here could signal the next move up so we can enter on confirmation, and target the next key level of 97.970.Stop-loss is recommended beyond the inflection zone.
❤️Sending you lots of Love and Hugs❤️

GOLD: Strong Growth Ahead! Long!
My dear friends,
Today we will analyse GOLD together☺️
The price is near a wide key level
and the pair is approaching a significant decision level of 3,431.19 Therefore, a strong bullish reaction here could determine the next move up.We will watch for a confirmation candle, and then target the next key level of 3,422.53.Recommend Stop-loss is beyond the current level.
❤️Sending you lots of Love and Hugs❤️

EURUSD: Will Go Up! Long!
My dear friends,
Today we will analyse EURUSD together☺️
The recent price action suggests a shift in mid-term momentum. A break above the current local range around 1.15537 will confirm the new direction upwards with the target being the next key level of 1.15800 and a reconvened placement of a stop-loss beyond the range.
❤️Sending you lots of Love and Hugs❤️

SILVER: The Market Is Looking Down! Short!
My dear friends,
Today we will analyse SILVER together☺️
The in-trend continuation seems likely as the current long-term trend appears to be strong, and price is holding below a key level of 36.303 So a bearish continuation seems plausible, targeting the next low. We should enter on confirmation, and place a stop-loss beyond the recent swing level.
❤️Sending you lots of Love and Hugs❤️
