DAX: Local Bearish Bias! Short!
My dear friends,
Today we will analyse DAX together☺️
The in-trend continuation seems likely as the current long-term trend appears to be strong, and price is holding below a key level of 24,252.78 So a bearish continuation seems plausible, targeting the next low. We should enter on confirmation, and place a stop-loss beyond the recent swing level.
❤️Sending you lots of Love and Hugs❤️
Ict

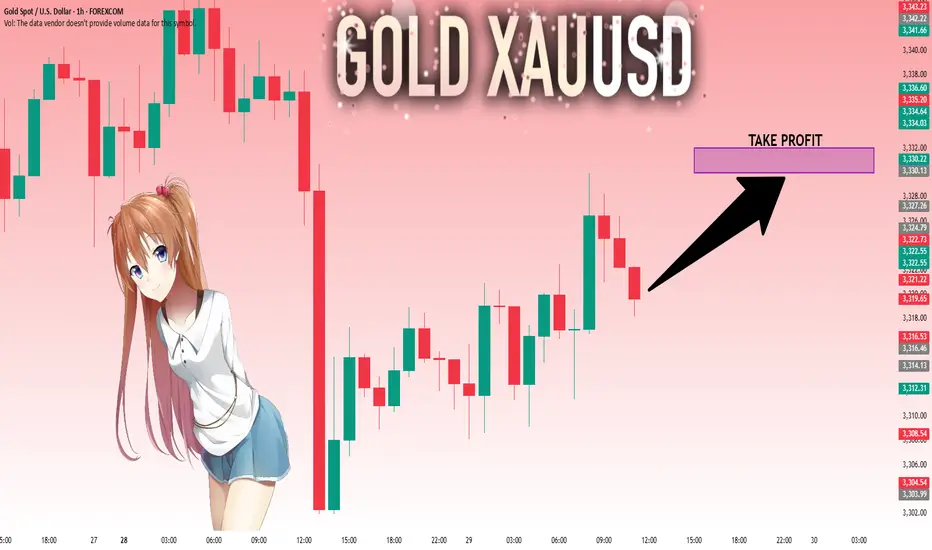
GOLD: Strong Growth Ahead! Long!
My dear friends,
Today we will analyse GOLD together☺️
The market is at an inflection zone and price has now reached an area around 3,321.22 where previous reversals or breakouts have occurred.And a price reaction that we are seeing on multiple timeframes here could signal the next move up so we can enter on confirmation, and target the next key level of 3,329.97.Stop-loss is recommended beyond the inflection zone.
❤️Sending you lots of Love and Hugs❤️
EURUSD: Will Go Up! Long!
My dear friends,
Today we will analyse EURUSD together☺️
The price is near a wide key level
and the pair is approaching a significant decision level of 1.15675 Therefore, a strong bullish reaction here could determine the next move up.We will watch for a confirmation candle, and then target the next key level of 1.16318.Recommend Stop-loss is beyond the current level.
❤️Sending you lots of Love and Hugs❤️

SILVER: The Market Is Looking Down! Short!
My dear friends,
Today we will analyse SILVER together☺️
The recent price action suggests a shift in mid-term momentum. A break below the current local range around 38.167 will confirm the new direction downwards with the target being the next key level of 37.976 .and a reconvened placement of a stop-loss beyond the range.
❤️Sending you lots of Love and Hugs❤️
EUR/USD 30-MIN ANALYSISThis EURUSD setup showcases a clean bullish continuation scenario following a confirmed Break of Structure (BOS) and a sharp rally driven by momentum and liquidity imbalance.
After sweeping a key low (XXX), price impulsively broke structure to the upside, confirming a potential shift in market intent. A retracement is now expected to mitigate the Buy-Side Imbalance (BISI) zone.
BOS & SSS (Short-Term Structural Shift): Confirmed bullish intent.
Imbalance (BISI): Price left behind an unfilled imbalance zone a likely magnet for a pullback.
Re-Entry Zone: (BISI) provides a high probability area for long re-entry.
Upside Targets:
Target 1: 1.15483 – intermediate structural level.
Target 2: 1.16158 – premium supply / liquidity target.
#EURUSD 30M Technical Analysis Expected Move.

GBPCAD OUTLOOKIn this analysis we're focusing on 2H time frame for finding possible upcoming movement in price. So as per my strategy today I'm looking for a sell trade opportunity. Confirmation is very important, after confirmation we'll execute our trade. Let's see which opportunity market will give us.
Always use stoploss for your trade.
Always use proper money management and proper risk to reward ratio.
This is my prediction.
#GBPCAD 1H Technical Analysis Expected Move.

EURJPY POSSIBLE EXPECTED MOVEIn this analysis we're focusing on 1H time frame. Today I'm looking for a potential buy move from my marked key levels. This is a higher time frame analysis. Let's analyze more deeply into smaller timeframe and potential outcomes. Confirmation is very important.
Always use stoploss for your trade.
Always use proper money management and proper risk to reward ratio.
This is my analysis.
#EURJPY 1H Technical Analysis Expected Move.

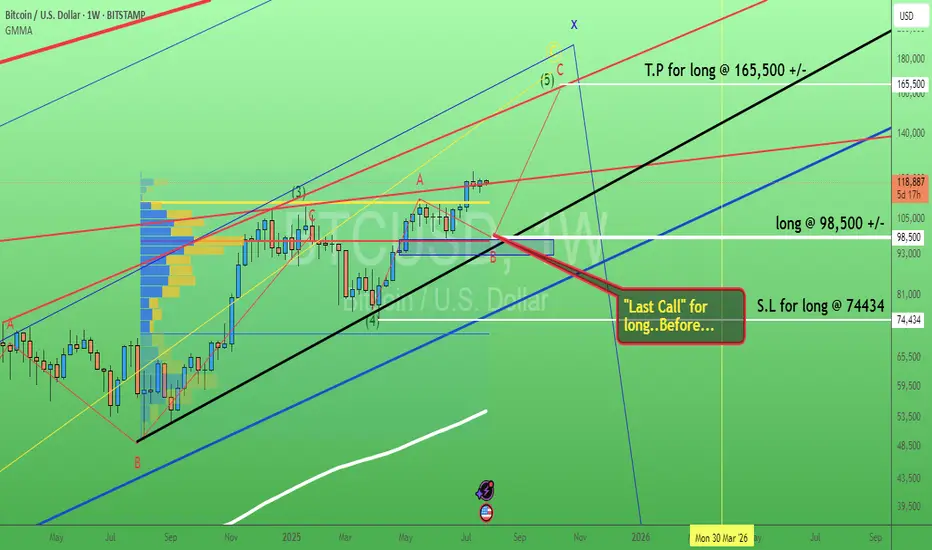
Bitcoin. Last call buy level? 29/July/25BTCUSD probably will have pullback toward confluence zone of 1) Trendline Support 2) Order Block 3) POC of volume before hitting ATH again
EUR/USD at a Turning Point:Rally or Trap for the Bulls?📉 Technical Analysis
Price has decisively broken out of the descending channel highlighted in recent weeks. The weekly support zone between 1.1540 – 1.1580 is holding, triggering a significant technical reaction. The weekly RSI has entered oversold territory, suggesting a potential short-term reversal.
Key Support: 1.1530–1.1580 (currently reacting)
Key Resistance: 1.1720–1.1780 (inefficiency & supply zone)
Base Case: Potential rebound toward 1.1720–1.1750 before next structural decision
🧠 Sentiment Analysis
82% of retail traders are long, with an average entry at 1.1635
Only 18% are short, a clear minority
This extreme imbalance suggests downside pressure may persist to flush out weak long hands before a genuine reversal takes place.
📊 COT (Commitment of Traders)
USD Index:
Non-Commercials increased both long (+663) and short (+449) positions → uncertain stance but slight USD strengthening
EUR Futures:
Non-Commercials increased long (+6,284) and short (+8,990) positions, but net increase favors the bears
This shift signals a bearish turn in sentiment among large speculators, indicating short-term downward pressure.
📈 Seasonality
In July, EUR/USD historically tends to rise, but:
This year’s price action is underperforming the seasonal pattern, showing relative weakness
August is historically flat to slightly bearish
Seasonality does not currently support a strong bullish continuation
✅ Strategic Conclusion
Current Bias: Bearish-neutral (with short-term bullish bounce expected)
A technical rebound toward 1.1720–1.1750 is likely (liquidity void + RSI bounce + retail imbalance)
However, 1.1720–1.1750 is a key supply zone to monitor for fresh shorts, in line with:
Dollar-supportive COT data
Overcrowded long retail positioning
Weak seasonal context
🧭 Operational Plan:
Avoid holding longs above 1.1750 without macro confirmation
Monitor price action between 1.1720–1.1750 for potential short re-entry
Clean breakout above 1.1780 → shift bias to neutral/bullish
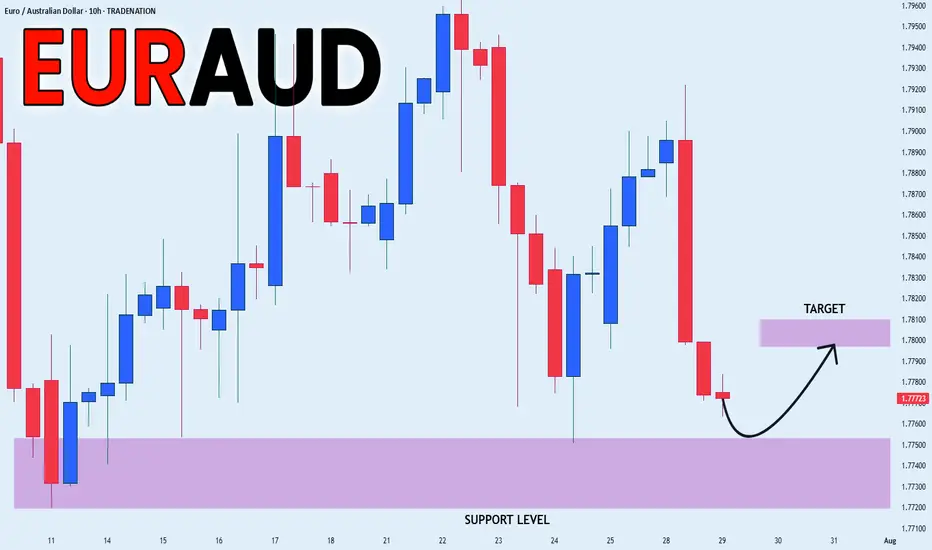
EUR_AUD LOCAL GROWTH AHEAD|LONG|
✅EUR_AUD will soon retest a key support level of 1.7750
So I think that the pair will make a rebound
And go up to retest the supply level above at 1.7800
LONG🚀
✅Like and subscribe to never miss a new idea!✅
Disclosure: I am part of Trade Nation's Influencer program and receive a monthly fee for using their TradingView charts in my analysis.
EUR-NZD Will Grow! Buy!
Hello,Traders!
EUR-NZD keeps falling
Down and we are bearish
Biased mid-term but there is
A horizontal support level
Below at 1.9370 so after
The retest we might expect
A local bullish correction
Buy!
Comment and subscribe to help us grow!
Check out other forecasts below too!
Disclosure: I am part of Trade Nation's Influencer program and receive a monthly fee for using their TradingView charts in my analysis.

GBP_CAD RISKY SETUP|LONG|
✅GBP_CAD is going down to retest
A horizontal support of 1.8320
Which makes me locally bullish biased
And I think that we will see a rebound
And a move up from the level
Towards the target above at 1.8380
LONG🚀
✅Like and subscribe to never miss a new idea!✅
Disclosure: I am part of Trade Nation's Influencer program and receive a monthly fee for using their TradingView charts in my analysis.

AUD-NZD Rebound Ahead! Buy!
Hello,Traders!
AUD-NZD made a retest
Of the wide horizontal support
Level again at 1.0909 and we
Are already seeing a bullish
Reaction so a local bullish
Rebound can be expected
Buy!
Comment and subscribe to help us grow!
Check out other forecasts below too!
Disclosure: I am part of Trade Nation's Influencer program and receive a monthly fee for using their TradingView charts in my analysis.

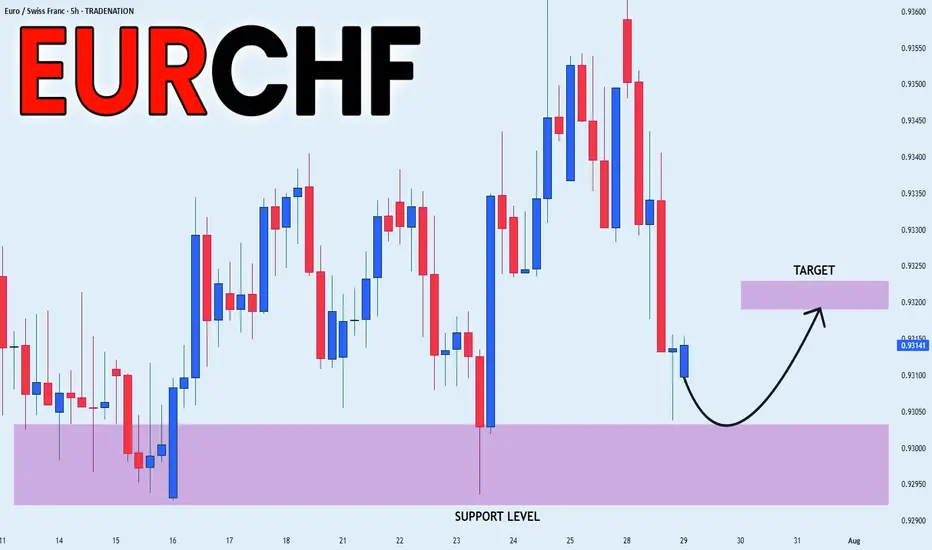
EUR_CHF RISKY LONG|
✅EUR_CHF is set to retest a
Strong support level below at 0.9300
After trading in a local downtrend for some time
Which makes a bullish rebound a likely scenario
With the target being a local resistance above at 0.9320
LONG🚀
✅Like and subscribe to never miss a new idea!✅
Disclosure: I am part of Trade Nation's Influencer program and receive a monthly fee for using their TradingView charts in my analysis.
USD_CHF SHORT FROM RESISTANCE|
✅USD_CHF has been growing recently
And the pair seems locally overbought
So as the pair is approaching
A horizontal resistance of 0.8064
Price decline is to be expected
SHORT🔥
✅Like and subscribe to never miss a new idea!✅
Disclosure: I am part of Trade Nation's Influencer program and receive a monthly fee for using their TradingView charts in my analysis.

USD-JPY Is Overbought! Sell!
Hello,Traders!
USD-JPY is trading in a
Strong uptrend and the pair
Will soon hit a horizontal
Resistance of 149.200
So after the retest a
Local bearish pullback
Is to be expected
Sell!
Comment and subscribe to help us grow!
Check out other forecasts below too!
Disclosure: I am part of Trade Nation's Influencer program and receive a monthly fee for using their TradingView charts in my analysis.

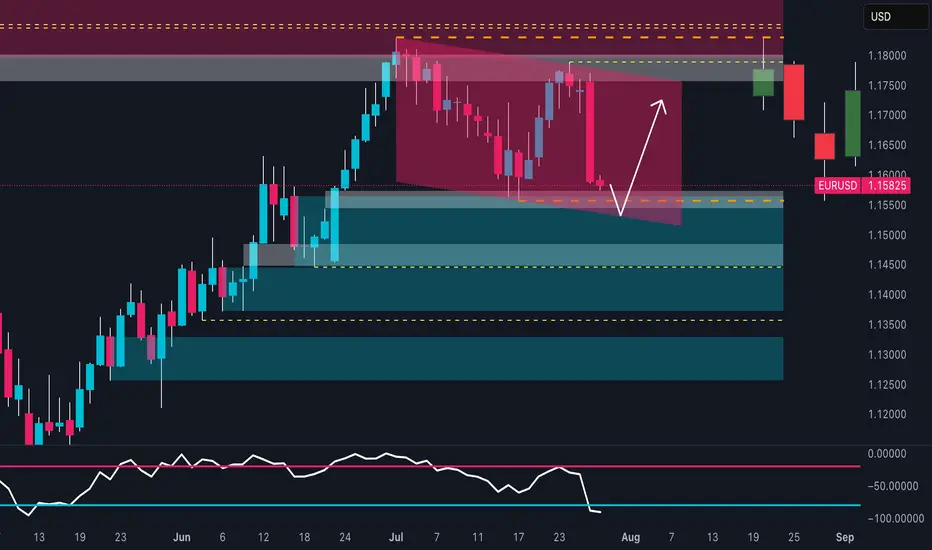
EUR-USD Support Ahead! Buy!
Hello,Traders!
EUR-USD is making a massive
Bearish correction and the pair
Is already locally oversold
So after it hits a horizontal
Support level below at 1.1568
We will be expecting a local
Bullish rebound
Buy!
Comment and subscribe to help us grow!
Check out other forecasts below too!
Disclosure: I am part of Trade Nation's Influencer program and receive a monthly fee for using their TradingView charts in my analysis.

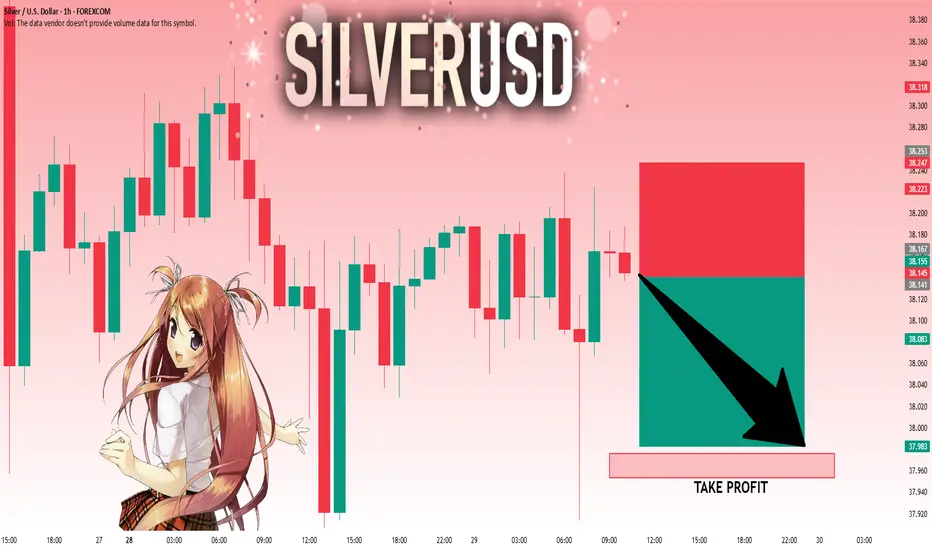
SILVER: Strong Growth Ahead! Long!
My dear friends,
Today we will analyse SILVER together☺️
The in-trend continuation seems likely as the current long-term trend appears to be strong, and price is holding above a key level of 38.099 So a bullish continuation seems plausible, targeting the next high. We should enter on confirmation, and place a stop-loss beyond the recent swing level.
❤️Sending you lots of Love and Hugs❤️

EURUSD: Will Go Down! Short!
My dear friends,
Today we will analyse EURUSD together☺️
The market is at an inflection zone and price has now reached an area around 1.15996 where previous reversals or breakouts have occurred.And a price reaction that we are seeing on multiple timeframes here could signal the next move down so we can enter on confirmation, and target the next key level of 1.15562..Stop-loss is recommended beyond the inflection zone.
❤️Sending you lots of Love and Hugs❤️

GOLD: The Market Is Looking Down! Short!
My dear friends,
Today we will analyse GOLD together☺️
The price is near a wide key level
and the pair is approaching a significant decision level of 3,313.85 Therefore, a strong bearish reaction here could determine the next move down.We will watch for a confirmation candle, and then target the next key level of 3,298.60..Recommend Stop-loss is beyond the current level.
❤️Sending you lots of Love and Hugs❤️
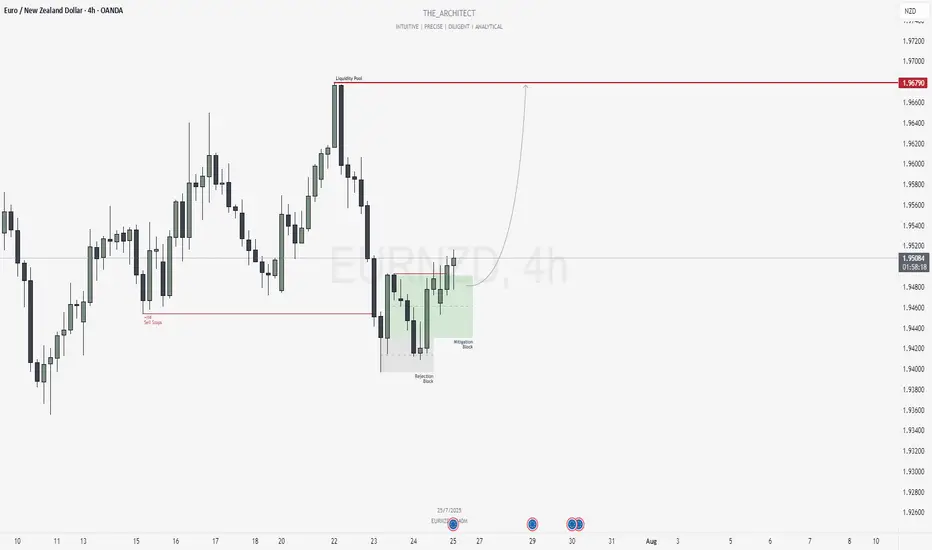
EURNZD: Bullish Shift and Institutional Re-Entry from SupportGreetings Traders,
In today’s analysis of EURNZD, we observe that institutional order flow on the H4 timeframe has recently shifted bullish. This alignment now provides us with a clear bias to seek buying opportunities in line with the predominant higher timeframe trend.
Higher Timeframe Context:
The weekly timeframe is currently delivering bullish order flow. With the recent bullish market structure shift (MSS) on the H4, we now have confluence across both timeframes, which strengthens our confidence in seeking long setups on lower timeframes.
Key Observations on H4:
Sell Stop Raid & Structural Rejection: Price action recently swept sell-side liquidity, a typical behavior indicating institutional order pairing. Following this, price attempted to move lower but failed to break the previous low, instead being supported by a Rejection Block. This led to a bullish market structure shift—our key signal of trend continuation.
Mitigation Block Entry Zone: Price has since retraced into a Mitigation Block—an area where previous institutional selling occurred. The purpose of this pullback is to mitigate earlier positions and initiate fresh buying orders. This now becomes our zone of interest for potential confirmation entries towards the upside.
Trading Plan:
Entry Strategy: Look for lower timeframe confirmation entries within the H4 Mitigation Block.
Target: The objective is to target the H4 liquidity pool residing at premium prices, aligning with the discount-to-premium delivery model.
For a detailed market walkthrough and in-depth execution zones, be sure to watch this week’s Forex Market Breakdown:https://www.tradingview.com/chart/EURNZD/BZC9xW1L-July-21-Forex-Outlook-Don-t-Miss-These-High-Reward-Setups/
As always, remain patient and disciplined. Wait for confirmation before executing, and manage your risk accordingly.
Kind Regards,
The Architect 🏛️📈
CHF-JPY Short From Resistance! Sell!
Hello,Traders!
CHF-JPY keeps trading in
An uptrend and the pair
Is locally overbought so after
The pair hits the horizontal
Resistance level of 186.000
We will be expecting a local
Bearish correction
Sell!
Comment and subscribe to help us grow!
Check out other forecasts below too!
Disclosure: I am part of Trade Nation's Influencer program and receive a monthly fee for using their TradingView charts in my analysis.

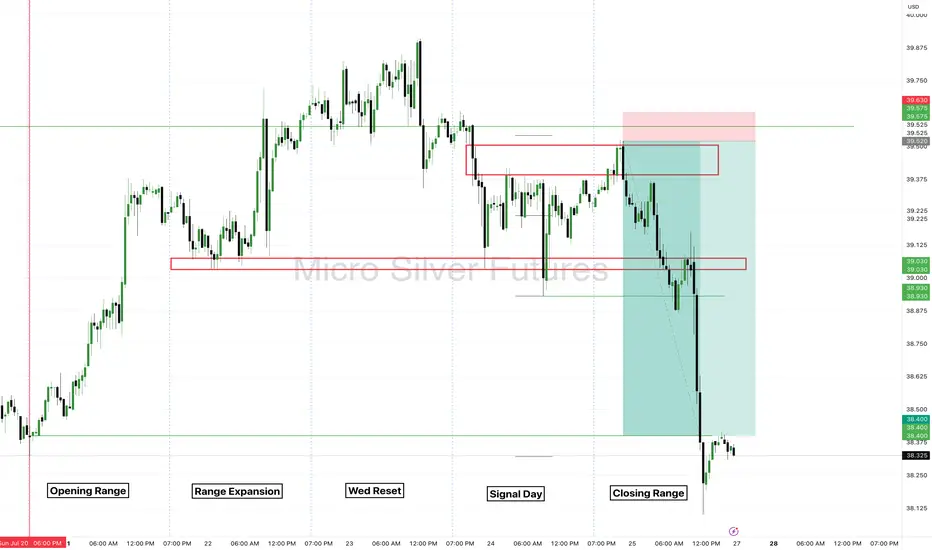
Silver Futures - Closing Range of the Week.Real trading comes down to the patience combined with emotional control to have the highest possible edge.
COMEX_MINI:SIL1!
There is no reason for your chart to filled be filled with ineffective distraction. Instead focus on simplicity to know exactly what to take a trade on. Be a hunter looking for the easy prey!