GBPUSD Bearish Setup📌 Current Market Structure
Liquidity Sweep + Rejection in Premium Zone:
Price tapped into the major supply zone (red box) sitting above the last high.
Liquidity above previous highs was swept, and now price is rejecting → a classic buy-side liquidity grab setup.
Bearish Rising Wedge Structure Broken:
Price broke the inner rising wedge (red trendlines) to the downside and is now retesting the supply zone.
Breakdown aligns with a potential reversal entry or at least a bearish pullback.
Higher Timeframe Supply Zone:
The red zone coincides with the 1.34782 resistance, which price failed to break cleanly above.
This zone holds institutional footprints → possible smart money distribution.
🧠 Trade Idea (Bearish Bias Confirmed)
✅ Entry: Already activated inside the red supply zone.
📍 Stop Loss: Just above the red box (around 1.3480).
🎯 Target Zones:
TP1: 1.33281 → minor demand zone and previous consolidation.
TP2: 1.32870 → previous BOS retest zone.
TP3: 1.32543 → deep demand zone and trendline intersection.
TP4: 1.31759–1.31554 → external liquidity resting below structure (long-term target).
🔻 Risk-to-Reward: Excellent potential up to 1:5+ RR if TP4 hits.
🔄 Reversal Signals Confirmation
Watch for:
Bearish engulfing candles with rising volume inside the red zone (VSA style).
Displacement candle or M5–M15 BOS confirming internal structure shift.
⚠️ Invalidation Zone
If price closes a 1H candle above 1.3480, setup is invalidated.
Watch out for possible manipulation during the vertical blue lines (likely high-impact news).
🔮 Forecast:
Expecting a mid- to long-term retracement or reversal back to the 1.31700s – 1.32800s region, based on the current rejection from premium supply and completion of a liquidity sweep.
Ict

GOLD WILL KEEP GROWING|LONG|
✅GOLD made a strong
Breakout of the key horizontal
Level of 32.60$ and kept on growing
Which reinforces our bullish
Bias and makes us expect
A further bullish move up
LONG🚀
✅Like and subscribe to never miss a new idea!✅
Disclosure: I am part of Trade Nation's Influencer program and receive a monthly fee for using their TradingView charts in my analysis.

CAD-JPY Will Go UP! Buy!
Hello,Traders!
CAD-JPY made a retest
Of the horizontal support
Of 103,431 and we are
Already seeing a bullish
Rebound so we will be
Expecting a further
Local bullish rebound
Buy!
Comment and subscribe to help us grow!
Check out other forecasts below too!
Disclosure: I am part of Trade Nation's Influencer program and receive a monthly fee for using their TradingView charts in my analysis.

DAX: Strong Growth Ahead! Long!
My dear friends,
Today we will analyse DAX together☺️
The price is near a wide key level
and the pair is approaching a significant decision level of 24,119.04. Therefore, a strong bearish reaction here could determine the next move down.We will watch for a confirmation candle, and then target the next key level of 24,214.64.Recommend Stop-loss is beyond the current level.
❤️Sending you lots of Love and Hugs❤️

GOLD: Will Go Down! Short!
My dear friends,
Today we will analyse GOLD together☺️
The recent price action suggests a shift in mid-term momentum. A break below the current local range around 3,301.89 will confirm the new direction downwards with the target being the next key level of 3,293.21 and a reconvened placement of a stop-loss beyond the range.
❤️Sending you lots of Love and Hugs❤️

SILVER: The Market Is Looking Down! Short!
My dear friends,
Today we will analyse SILVER together☺️
The in-trend continuation seems likely as the current long-term trend appears to be strong, and price is holding below a key level of 33.222 So a bearish continuation seems plausible, targeting the next low. We should enter on confirmation, and place a stop-loss beyond the recent swing level.
❤️Sending you lots of Love and Hugs❤️

EURUSD: Strong Bullish Sentiment! Long!
My dear friends,
Today we will analyse EURUSD together☺️
The market is at an inflection zone and price has now reached an area around 1.13276 where previous reversals or breakouts have occurred.And a price reaction that we are seeing on multiple timeframes here could signal the next move down so we can enter on confirmation, and target the next key level of 1.13540.Stop-loss is recommended beyond the inflection zone.
❤️Sending you lots of Love and Hugs❤️

BITCOIN Free Signal! Sell!
Hello,Traders!
BITCOIN keep growing in a
Strong uptrend but the price
Will soon hit an an all-time-high
Price around 109,400$ which
Is also a resistance from where
We can go short with the
Take Profit of 103,900$
And the Stop Loss of 109,739$
Sell!
Comment and subscribe to help us grow!
Check out other forecasts below too!
Disclosure: I am part of Trade Nation's Influencer program and receive a monthly fee for using their TradingView charts in my analysis.

NZDJPY bearish continuation📌 Key Observations
Previous Structure Shift (QM + Break of Structure):
There was a clear Quasimodo (QM) formation at the top, followed by a break of structure to the downside, confirming bearish intent.
The high created liquidity and was swept—then price broke below the QM low confirming order flow shift.
Bearish Channel Breakout & Retest:
Price broke below the rising wedge (bearish reversal pattern).
Retested inside a minor bearish flag now acting as a continuation pattern (currently breaking it down again).
Current Price Action:
Price is reacting to a supply zone inside the red box, which also aligns with:
A previous order block.
A potential breaker structure.
This zone also represents a BOS retest.
🧠 Trade Idea (Sell Bias Confirmed)
✅ Entry: Inside the red supply zone (already showing rejection).
🎯 Target Zones:
TP1: 85.15 → minor demand zone + previous structure.
TP2: 84.20 → mid-level POI.
TP3: 83.14 → major demand/FVG zone.
TP4: 82.58 → extreme demand and liquidity resting point.
📍 Stop Loss: Above the red zone, ~85.95 to 86.00 area.
🔻 Risk-to-Reward (RR): The RR to final target (TP4) looks excellent (~1:4 to 1:5+).
🧩 Volume/Engulfing Confirmation (Optional)
You may wait for a bearish engulfing candle inside the red zone with bearish volume to confirm entry if you're applying your VSA + engulfing method.

US30: Bears Are Winning! Short!
My dear friends,
Today we will analyse US30 together☺️
The price is near a wide key level
and the pair is approaching a significant decision level of 42,703.0 Therefore, a strong bearish reaction here could determine the next move down.We will watch for a confirmation candle, and then target the next key level of 42,646.1.Recommend Stop-loss is beyond the current level.
❤️Sending you lots of Love and Hugs❤️

SILVER: Next Move Is Up! Long!
My dear friends,
Today we will analyse SILVER together☺️
The recent price action suggests a shift in mid-term momentum. A break above the current local range around 32.982 will confirm the new direction upwards with the target being the next key level of 33.261 and a reconvened placement of a stop-loss beyond the range.
❤️Sending you lots of Love and Hugs❤️

Google is about to rise by atleast 10% in coming days!I expect Google share price to rise by atleast 10% within the next 2 weeks.
Reasons;
Monthly is massively bullish.
Weekly is also bullish.
Daily is also bullish.

EURUSD: Target Is Down! Short!
My dear friends,
Today we will analyse EURUSD together☺️
The in-trend continuation seems likely as the current long-term trend appears to be strong, and price is holding below a key level of 1.12459 So a bearish continuation seems plausible, targeting the next low. We should enter on confirmation, and place a stop-loss beyond the recent swing level.
❤️Sending you lots of Love and Hugs❤️

GOLD: Move Up Expected! Long!
My dear friends,
Today we will analyse GOLD together☺️
The market is at an inflection zone and price has now reached an area around 3,380.59 where previous reversals or breakouts have occurred.And a price reaction that we are seeing on multiple timeframes here could signal the next move up so we can enter on confirmation, and target the next key level of 3,309.37.Stop-loss is recommended beyond the inflection zone.
❤️Sending you lots of Love and Hugs❤️

What Is the ICT Silver Bullet Strategy, and How Does It Work?What Is the ICT Silver Bullet Strategy, and How Does It Work?
The ICT Silver Bullet strategy offers traders a unique approach to capitalising on market opportunities during specific trading hours. This article explored this advanced strategy, explaining the role of fair value gaps, liquidity, and timeframes and how to implement it.
Understanding the ICT Silver Bullet Strategy
The ICT Silver Bullet trading strategy is a sophisticated trading methodology developed by Michael J. Huddleston, known as the Inner Circle Trader, or ICT. This strategy is designed to capitalise on specific, high-probability trading opportunities that align with certain times throughout certain sessions, specifically the London and New York sessions.
Central to the ICT Silver Bullet strategy are two key concepts: liquidity and fair value gaps. Liquidity in this context refers to places within the market where there is significant trading activity, often indicated by previous highs and lows of a trading session or historical price points that attract significant interest from traders.
Fair value gaps are price areas that were either skipped over quickly during rapid price moves or areas where the price has not returned for a significant period, reflecting a disparity between perceived value and market price.
The strategy's effectiveness hinges on executing trades during specific one-hour windows known as Silver Bullet times. By focusing on these concepts and timings, traders can more accurately analyse market movements and align their trades with the influxes of smart money, potentially improving their returns by catching swift moves towards liquidity points.
Key Components of the Strategy
The Silver Bullet ICT strategy employs a detailed approach to trading that revolves around understanding market dynamics at critical times. Here are the key components that define this strategy:
Fair Value Gaps
A fair value gap (FVG) occurs when the price quickly moves away from a level without significant trading occurring at that price, leaving a "gap" that is likely to be tested again when the price returns to this point. In the context of the ICT Silver Bullet strategy, these gaps are targeted because they represent potential inefficiencies in the market where the price may return to balance or fill the gap. Traders using this strategy watch these gaps closely as they often present clear entry points when approached again.
Liquidity Targets
Liquidity targets are essentially areas where there is expected to be a significant volume of orders, which can lead to particular price movements when these levels are approached. These include:
- Previous session highs and lows: These are often areas where stop-loss orders accumulate, making them prime targets for liquidity-driven price moves.
- Swing points in the market: Key reversals and continuation points that have historical significance.
- Psychological levels: These include round numbers or price levels ending in '00' or '50', which often act as focal points for trading activity.
Specific Trading Times
Unlike many strategies that align strictly with market opening times, the ICT Silver Bullet trading strategy utilises specific one-hour windows during the day when liquidity and volatility are expected to be high due to trader participation across the globe. These Silver Bullet hours are strategically chosen based on their potential to tap into significant market moves:
- London Open Silver Bullet: Occurs from 3:00 AM to 4:00 AM Eastern Standard Time (EST) in winter and from 2:00 AM to 3:00 AM in summer, which is 8:00 AM to 9:00 AM Greenwich Mean Time (GMT) in winter and 7:00 AM to 8:00 AM in summer.
- New York AM Session Silver Bullet: From 10:00 AM to 11:00 AM EST, translating to 3:00 PM to 4:00 PM GMT.
- New York PM Session Silver Bullet: From 2:00 PM to 3:00 PM EST or 7:00 PM to 8:00 PM GMT.
These time slots are selected based on historical data showing heightened trading activity and, therefore, increased opportunities to capture moves towards identified liquidity targets.
Implementing the ICT Silver Bullet Strategy
Traders utilising the ICT Silver Bullet strategy typically prepare by marking potential fair value gaps and liquidity targets before these key trading times. As these windows approach, they monitor price action closely for signs that the market is moving bullishly or bearishly toward these liquidity points, enabling them to search for an entry.
Note that because this is an intraday strategy, ICT says it’s better to use a 15-minute timeframe or lower. Most traders use the 1-minute to 5-minute for the Silver Bullet setup, though those inexperienced with the strategy may prefer the 5-minute.
Here’s a breakdown of the strategy:
Entry
- Market Direction and Liquidity Analysis: Before the designated Silver Bullet timeframes, traders perform a detailed assessment of the market direction on higher timeframes, such as the 15-minute to 4-hour charts. This initial analysis is crucial to align their strategies with the market's overall momentum.
- Identifying Key Liquidity Points: Traders also mark significant liquidity targets during their analysis, such as previous session/day highs and lows. These points are expected to attract significant trading activity and thus are critical for planning entry points.
- Formation of Fair Value Gaps (FVG): During the Silver Bullet hours—specifically from 3:00 AM to 4:00 AM, 10:00 AM to 11:00 AM, and 2:00 PM to 3:00 PM EST—traders watch for the market to approach these liquidity points and leave behind a Fair Value Gap. This movement is essential as it indicates a potential inefficiency in price that the market may seek to correct.
- Setting Limit Orders at FVGs: Once an FVG is identified, traders set their limit orders at the boundary of the FVG closest to their intended trade direction. If aiming for a long position, the order is placed at the top of the FVG; for a short position, at the bottom. This method allows traders to potentially enter the market as it moves to 'fill' the gap, aligning with the initial momentum assessment and the subsequent market reaction to liquidity levels.
Stop Loss
- Initial Placement: Traders typically place stop-loss orders to potentially manage risk tightly with respect to the FVG's structure. If trading long, the stop loss might be set just below the low of the candle that forms the FVG; if trading short, just above the high.
- Swing Points: Alternatively, stop losses might also be placed beyond recent swing highs or lows, providing a buffer against market volatility and minor fluctuations that do not affect the overall market trend.
Take Profit
- Targeting Liquidity Points: The common practice for setting take-profit points involves aiming for the next significant liquidity target identified during the preparatory phase.
- Risk-to-Reward Considerations: Many traders set their take-profit goals based on a calculated risk-to-reward ratio, often aiming for at least a 1:2 ratio. This means that for every unit of risk taken, two units of reward are targeted. In terms of pips, traders generally look for at least 15 pips when trading forex and 10 points in indices.
EUR/USD Example
In the provided EUR/USD chart example, a detailed analysis of higher timeframes has established a bearish outlook. Consequently, the focus is on identifying short trading opportunities while disregarding potential long setups.
During the 8:00 AM to 9:00 AM GMT window, there's a noticeable Fair Value Gap (FVG) that forms following a swift rejection from an upward move. This price action reflects a viable entry point for a short position. Traders could place a limit order at the bottom boundary of the candle that initiated the FVG, with a stop loss positioned just above the candle's high or the nearby swing point high, depending on their risk tolerance. The target for this trade is set at the previous day's low, which is reached and prompts a short-term reversal in price direction.
Later in the day, between 7:00 PM and 8:00 PM GMT, another FVG develops. Following the same principle, we can enter at the bottom of the FVG. Setting a stop loss above the swing high is considered more prudent than directly above the candle high, which in this case would likely lead to a stop-out due to the tightness of the entry. Since the previous day’s low has already been reached earlier, the next logical target is the low of the US session, aligning with the day's bearish momentum.
The Bottom Line
The ICT Silver Bullet strategy provides a precise framework for traders looking to exploit specific market conditions tied to the rhythmic movements of liquidity and price during crucial trading hours. By focusing on fair value gaps and strategic entry points, traders can align their actions with significant market forces.
FAQs
What Is the Silver Bullet Strategy in Trading?
The Silver Bullet strategy in trading is a specific, time-sensitive approach designed to capitalise on liquidity and fair value gaps that typically form during key periods of market volatility. Developed by Michael J. Huddleston, also known as ICT, it aims to take advantage of the movements that occur when the market reacts to these gaps during certain hours of the trading day.
What Time Is the Silver Bullet Strategy?
The Silver Bullet strategy is executed during three distinct one-hour windows corresponding to heightened market activity periods. These are:
- London Open Silver Bullet: Occurs from 3:00 AM to 4:00 AM Eastern Standard Time (EST) in winter and from 2:00 AM to 3:00 AM in summer, which is 8:00 AM to 9:00 AM Greenwich Mean Time (GMT) in winter and 7:00 AM to 8:00 AM in summer.
- New York AM Session Silver Bullet: 10:00 AM to 11:00 AM EST (3:00 PM to 4:00 PM GMT).
- New York PM Session Silver Bullet: 2:00 PM to 3:00 PM EST (7:00 PM to 8:00 PM GMT).
How Long Does Silver Bullet Last?
As an intraday trading strategy, the Silver Bullet targets quick, short-term trades within specific one-hour windows. The trades are typically intended to be closed by the end of the trading day, capitalising on rapid movements towards and away from liquidity points.
This article represents the opinion of the Companies operating under the FXOpen brand only. It is not to be construed as an offer, solicitation, or recommendation with respect to products and services provided by the Companies operating under the FXOpen brand, nor is it to be considered financial advice.

GBP_NZD WILL GROW|LONG|
✅GBP_NZD has retested a key support level of 2.2520
And as the pair is already making a bullish rebound
A move up to retest the supply level above at 2.2600 is likely
LONG🚀
✅Like and subscribe to never miss a new idea!✅
Disclosure: I am part of Trade Nation's Influencer program and receive a monthly fee for using their TradingView charts in my analysis.

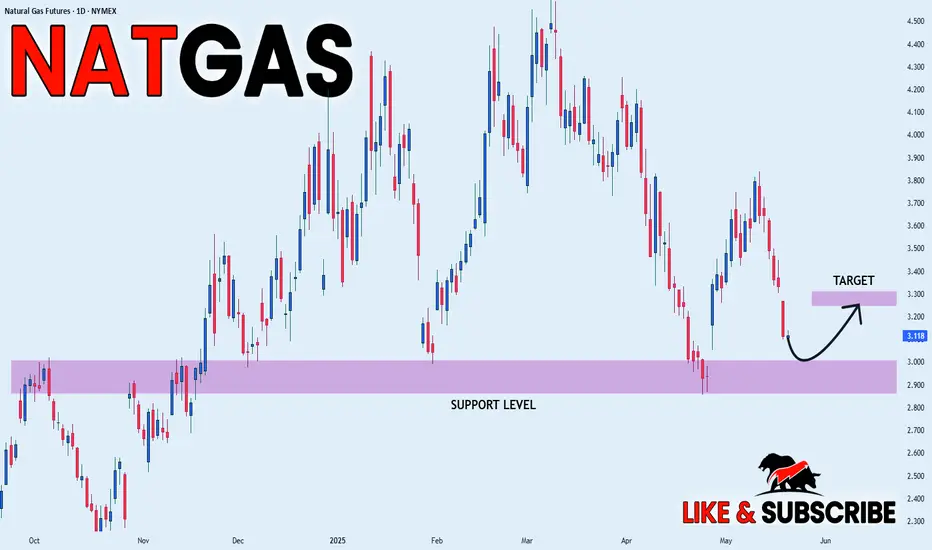
NATGAS SWING LONG|
✅NATGAS is set to retest a
Strong support level below at 2.90$
After trading in a local downtrend from some time
Which makes a bullish rebound a likely scenario
With the target being a local resistance above at 3.26$
LONG🚀
✅Like and subscribe to never miss a new idea!✅
Disclosure: I am part of Trade Nation's Influencer program and receive a monthly fee for using their TradingView charts in my analysis.
XAUUSD ICT analysis W1 rejected from the W1 FVG
D1 shows PDL manipulation --> next day model (bullish)
H4 CISD -- This confirmed the bullishnexx
Target - D1 Swing point , but since today was an inside bar , this shows consolidation and creates more liquidity for the price to take on the following day.
But from where ?
from H4 POI - FVG , this POI is located below the today's low which serves as the liquidity.

EUR_USD WILL GO DOWN|SHORT|
✅EUR_USD has retested a
Resistance level of 1.1290
And we are seeing a bearish reaction
With the price going down so we are
Bearish biased now and we will be
Expecting the pair to go further down
SHORT🔥
✅Like and subscribe to never miss a new idea!✅
Disclosure: I am part of Trade Nation's Influencer program and receive a monthly fee for using their TradingView charts in my analysis.

DXY: Local Bullish Bias! Long!
My dear friends,
Today we will analyse DXY together☺️
The price is near a wide key level
and the pair is approaching a significant decision level of 99.946Therefore, a strong bullish reaction here could determine the next move up.We will watch for a confirmation candle, and then target the next key level of 100.223.Recommend Stop-loss is beyond the current level.
❤️Sending you lots of Love and Hugs❤️

GOLD: Absolute Price Collapse Ahead! Short!
My dear friends,
Today we will analyse GOLD together☺️
The recent price action suggests a shift in mid-term momentum. A break below the current local range around 3,233.07 will confirm the new direction downwards with the target being the next key level of 3,221.68 and a reconvened placement of a stop-loss beyond the range.
❤️Sending you lots of Love and Hugs❤️

SILVER: Will Go Down! Short!
My dear friends,
Today we will analyse SILVER together☺️
The in-trend continuation seems likely as the current long-term trend appears to be strong, and price is holding below a key level of 32.359 So a bearish continuation seems plausible, targeting the next low. We should enter on confirmation, and place a stop-loss beyond the recent swing level.
❤️Sending you lots of Love and Hugs❤️

EURUSD: The Market Is Looking Up! Long!
My dear friends,
Today we will analyse EURUSD together☺️
The market is at an inflection zone and price has now reached an area around 1.12314 where previous reversals or breakouts have occurred.And a price reaction that we are seeing on multiple timeframes here could signal the next move up so we can enter on confirmation, and target the next key level of 1.12646.Stop-loss is recommended beyond the inflection zone.
❤️Sending you lots of Love and Hugs❤️
