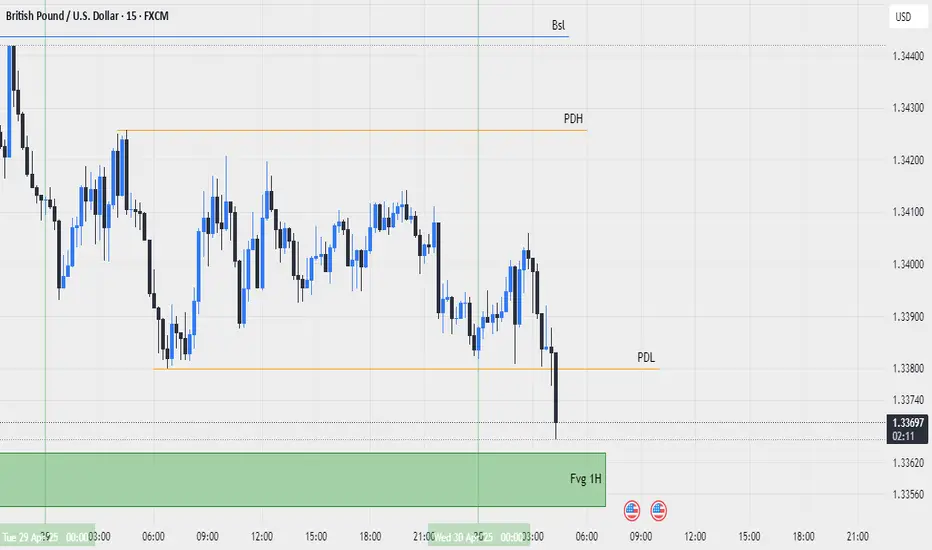
gbpusd 2025-4-30today price is below od pdl so we expect price go up
on bottom of this price we have fvg 1hour ,if price reach to this level we must wait to see up setup and trade on it
Ict
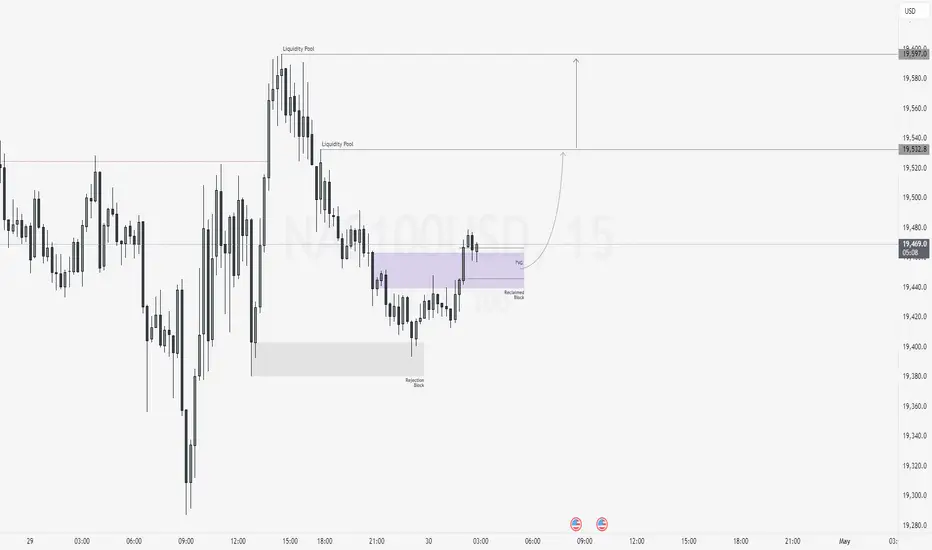
NAS100USD: Bullish Continuation from Reclaimed SupportGreetings Traders,
In today’s analysis on NAS100USD, we identify ongoing bullish institutional order flow, and as such, we aim to align our trading opportunities with this upward bias.
Key Observations:
1. Retracement and Institutional Support:
Recent price action shows a healthy retracement, with price finding institutional support at the rejection block. This was followed by strong displacement to the upside, resulting in a bullish market structure shift. This suggests the retracement may be complete, with further bullish continuation likely.
2. Reclaimed Order Block as Key Support Zone:
Currently, price is approaching a reclaimed order block—a zone where institutions previously initiated buying before price traded higher. When price returns to this area, institutions often reclaim the zone to initiate new long positions. This reclaimed block is further strengthened by the alignment with a fair value gap (FVG), enhancing the zone’s validity as institutional support.
Trading Plan:
We will monitor this reclaimed FVG zone for confirmation of bullish intent. Upon confirmation, we will look to enter long positions targeting liquidity pools in premium pricing zones, where buy-side liquidity is likely to reside.
Stay disciplined, wait for confirmation, and ensure the idea aligns with your broader strategy.
Kind Regards,
The Architect
USDCAD | Technical Rebound or Final Stop Before the Crash?USDCAD is currently in a highly delicate phase: the price has reached a key weekly demand zone between 1.3720–1.3820, which overlaps with a strong Fibonacci retracement cluster (0.705–0.78) of the previous bullish leg. So far, the reaction has been muted, but price compression and fading volatility suggest a potential short-term rebound.
However, looking at the bigger picture, the macro and positioning signals are flashing red for the US dollar:
📊 COT Report: Non-Commercials are significantly increasing short positions on USD and reducing shorts on CAD → bearish bias on USDCAD
🧠 Retail sentiment: Most retail traders are long on USDCAD → contrarian bearish bias
🗓️ Seasonality: May is historically negative for the USD and positive for the CAD → further confirms the short thesis
Only a structural recovery above 1.4150 on the weekly close would invalidate the bearish setup. Until then, any retracement towards 1.3980–1.4050 should be seen as an opportunity to sell strength.
🎯 Key Levels:
Sell zone: 1.3980–1.4050
Invalidation: Weekly close > 1.4150
Targets: 1.3720 – 1.3550
🔔 Critical note: When everyone is long, often the only direction left is down.

NZD-JPY Potential Long! Buy!
Hello,Traders!
NZD-JPY is going down
Now but the pair will soon
Hit a horizontal support
Level around 84.000 from
Where we will be expecting
A local bullish rebound
And a further move up
Buy!
Comment and subscribe to help us grow!
Check out other forecasts below too!
Disclosure: I am part of Trade Nation's Influencer program and receive a monthly fee for using their TradingView charts in my analysis.

NZD-USD Long From Support! Buy!
Hello,Traders!
NZD-USD is making a local
Bearish correction but will
Soon hit a horizontal support
Around 0.5915 from where
We will be expecting a
Local bullish rebound
Buy!
Comment and subscribe to help us grow!
Check out other forecasts below too!
Disclosure: I am part of Trade Nation's Influencer program and receive a monthly fee for using their TradingView charts in my analysis.

NQ Buyside IdeaTargetting that Asian session, After they stopped us out on a previous trade, once we traded above the NWOG and retested that 50% I entered once again expecting to find support. Final target being ASIAN Highs.

GBPJPY bearish move🔹 Pair / TF | GBP/JPY, 1 h → 15 m |
| 🔹 Bias | Bearish (selling the break of support) |
1. 📊 Key Levels
Level Price Role
R1 191.721 Major resistance (green)
Broken Support 190.65 (black line) Minor support → now resistance
R4 189.828 Next minor support
R2 189.355 Next major support
2. 🚨 Trigger
Price closes below the 190.65 support (black line) on 1 h, AND
200-hour MA (red) has just been rejected—sellers stepping in.
This decisive break flips 190.65 into new resistance.
3. ✅ Confirmation
RFI oscillator on 15 m dips below its rising trendline and fails to reclaim it.
Momentum is clearly bearish—no divergence or oversold reversal signal.
4. 🎯 Entry & Stops
| 🔶 Entry Zone | 0.19060–0.19050 (just below 190.65) | | 🔴 Stop-Loss | 0.19180 (above R1 at 191.72) ≈ 120 pips |
Place a Sell-Stop at 0.19055 (mid-zone).
Risk: 1–2% of account on ~120-pip SL.
5. 🎯 Profit Targets
Target Level Pips RRR
T1 R4 189.828 ~82 pips 1 : 0.7
T2 R2 189.355 ~125 pips 1 : 1
Scale out:
Exit ½ at T1.
Let the rest run to T2.
6. ⚙️ Trade Management
Move SL to breakeven once +40 pips in profit.
Monitor RFI on 15 m:
If RFI spikes above its trendline before T1, close remaining.
Adjust if you see large wicks or volume spikes into support zones.
7. 🔑 Rationale
Support→Resistance flip at 190.65 gives a logical entry & SL.
200-hour MA rejection confirms sellers overpowering buyers.
RFI confirms sustained bearish momentum.
High RRR (>1 : 1) ensures edge even with a moderate win-rate.
⚡ Highlight:
This is a bank-order-flow style fade—selling the break of minor support after a MA confluence test, riding momentum into larger support zones.

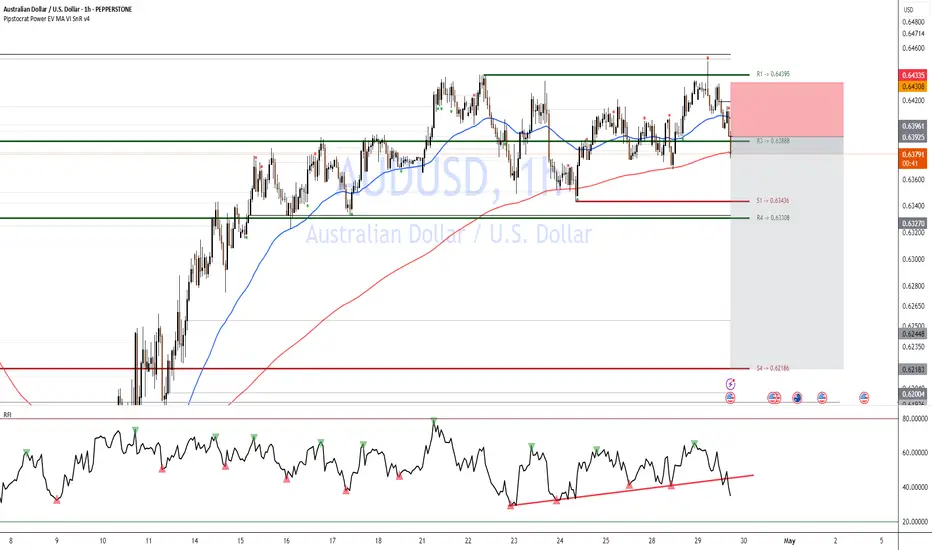
AUSSIE bearish move Short-setup: Breakdown of Support (AUD/USD)
Trigger: Price has decisively broken below R3 (0.63888) and the 200-hour MA (red) on the 1h chart.
Confirmation: RFI just dipped below its ascending trendline and failed to reclaim it—momentum is bearish.
Entry: Short at market 0.6385–0.6380 (just below R3).
Initial Stop: Above R1 (0.64395) ≈ 55 pips stop.
Targets:
T1: S1 (0.63436) (~40 pips → RRR ≈ 1 : 0.7)
T2: R4 (0.63308) (~55 pips → RRR ≈ 1 : 1)
⚡ Highlight: This is a bank-order-flow style fade—selling the break of minor support after a test of the 200-hour MA confluence.
🔑 Rationale
Support→Resistance flip at R3 gives logical entry & SL.
200-hour MA rejection confirms sellers overpowering buyers.
RFI confirms sustained bearish momentum.
High RRR (>1:1) ensures edge even with moderate win-rate.
NZDUSD Bearish moveShort-setup: breakdown of support
Trigger: Price has decisively broken below S1 (0.59337) and the 200-hour MA (red) on the 1h chart.
Confirmation: RFI just dipped below its ascending trendline and failed to reclaim it—momentum is bearish.
Entry: Short at market 0.5930–0.5925 (just below S1).
Initial Stop: Above R2 at 0.5944 (≈15-18 pips stop).
Targets:
T1: S2 at 0.5886 (~45 pips → RRR ≈ 1:3)
T2: R3 (long-term) at 0.5853 if momentum stays strong (~75 pips → RRR ≈ 1:5)
⚡ Highlight: This is a bank-order-flow style fade—selling the break of the minor support after a test of the 200-hour MA confluence.

NQ KEY ICT LEVELS - 29th APRIL 2025Levels marked on the chart using my free indicator which marks out all of the ICT key levels which can be used for potential POIs where price might react

DXY: Will Go Up! Long!
My dear friends,
Today we will analyse DXY together☺️
The market is at an inflection zone and price has now reached an area around 98.933 where previous reversals or breakouts have occurred.And a price reaction that we are seeing on multiple timeframes here could signal the next move up so we can enter on confirmation, and target the next key level of 99.097.Stop-loss is recommended beyond the inflection zone.
❤️Sending you lots of Love and Hugs❤️

GOLD: The Market Is Looking Down! Short!
My dear friends,
Today we will analyse GOLD together☺️
The price is near a wide key level
and the pair is approaching a significant decision level of 3,314.09 Therefore, a strong bearish reaction here could determine the next move down.We will watch for a confirmation candle, and then target the next key level of 3,296.10..Recommend Stop-loss is beyond the current level.
❤️Sending you lots of Love and Hugs❤️

SILVER: Strong Bearish Sentiment! Short!
My dear friends,
Today we will analyse SILVER together☺️
The recent price action suggests a shift in mid-term momentum. A break below the current local range around 33.293 will confirm the new direction downwards with the target being the next key level of 33.052.and a reconvened placement of a stop-loss beyond the range.
❤️Sending you lots of Love and Hugs❤️

EURUSD: Bulls Are Winning! Long!
My dear friends,
Today we will analyse EURUSD together☺️
The in-trend continuation seems likely as the current long-term trend appears to be strong, and price is holding above a key level of 1.13750 So a bullish continuation seems plausible, targeting the next high. We should enter on confirmation, and place a stop-loss beyond the recent swing level.
❤️Sending you lots of Love and Hugs❤️

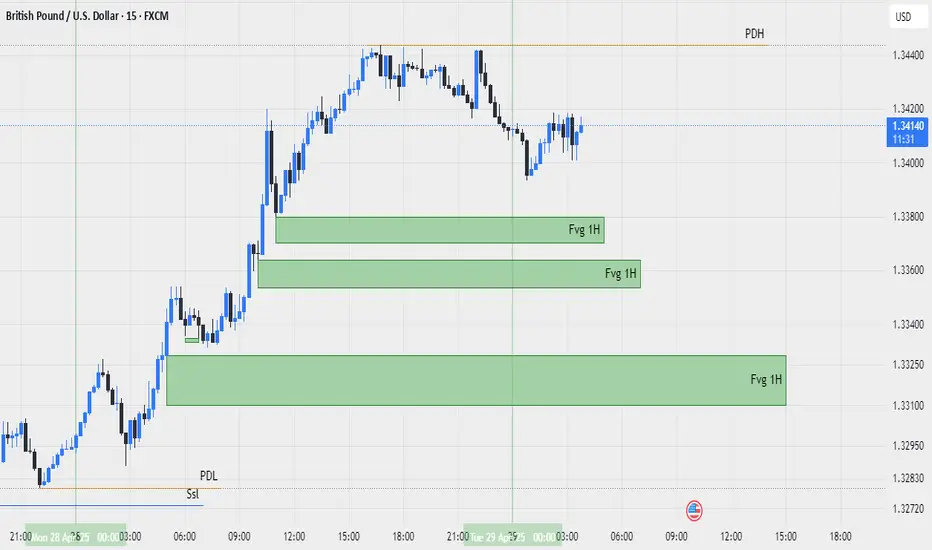
gbpusd 2025-4-29we have some level for trade
on top we have pdh , when price go up and reach to this level we wait to see sell setup
on bottom we have some fvg 1h , when price go down and reach to this level we wait to see buy setup , second fvg is more confident
NAS100USD: Institutional Selling Initiated at Premium LevelsGreetings Traders,
Today on NAS100USD, the market is currently operating within a clear bearish institutional order flow. In alignment with this directional bias, we are seeking selling opportunities supported by several key confluences.
Key Observations:
1. Liquidity Sweep at Premium Pricing:
Price has retraced deeply into a premium zone, sweeping the buy stops above a recent swing high. This suggests smart money is executing sell-side order pairing at extreme premium levels, utilizing retail liquidity for institutional distribution. When this occurs, price typically seeks rebalancing at fair value zones and continues toward discount levels.
2. Resistance at Fair Value Gap:
Following the liquidity sweep, price encountered resistance at a previously identified fair value gap (FVG). This FVG has held effectively, reinforcing the bearish outlook and acting as a high-probability rejection zone.
3. Market Structure Shift (MSS):
The market has now confirmed a bearish market structure shift, further validating the downside bias. This shift positions us to anticipate a continuation move.
4. Mitigation Block as Entry Zone:
We are currently watching a mitigation block for potential re-entries. These blocks represent zones where smart money mitigates previous long positions and introduces new short positions in alignment with the prevailing trend. If confirmed, they offer a strategic point to enter short trades.
Trading Plan:
Monitor the mitigation block for confirmation and look to enter with the broader institutional trend. Targets will include fair value regions and deeper liquidity pools at discount prices.
Remain patient and disciplined, and always ensure your analysis aligns with your trading plan.
Kind Regards,
The Architect

XAU and how i'd trade this guylast week was horrible for buyer, i reckong it will follow its momentum and attack that weekly low i marked down there, otherwise that high still got some chance to be wrecked. Be flexible.

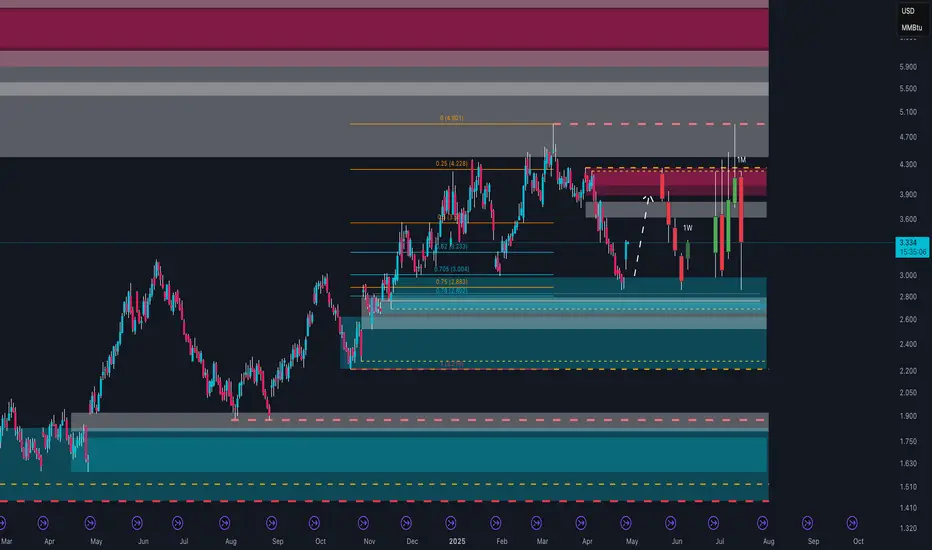
Natural Gas Ready to Explode?In recent months, Natural Gas (NG1!) has shown significant volatility, but now there are clear signals suggesting a major directional move could be imminent.
On the weekly technical chart, price has bounced from a strong demand zone between 2.50 and 2.70 USD/MMBtu, an area historically defended by institutional players. Currently, it is trading above 3.30 USD, consolidating in preparation for the next move. Key resistance zones to watch are between 3.90 and 4.20 USD, a region of high volume confluence and institutional supply.
Retail sentiment is extremely interesting: over 75% of retail traders are currently long. Historically, an excess of retail longs often leads to either corrections or accumulation/distribution phases, as large players tend to act against the majority.
Looking at the COT Report, the data supports the bullish thesis: non-commercials (speculative funds) remain net short, while commercials (physical operators) are increasing their long positions, indicating expectations of higher real demand in the medium term. This is a historically bullish signal, although it may not materialize immediately: commercials often start accumulating well before price movements occur.
Finally, seasonality favors the bulls: historically, from late April through mid-June, Natural Gas tends to perform positively, fueled by storage accumulation ahead of summer and the following winter season.
Strategically, a consolidation phase above 2.90–3.00 USD could serve as a base for larger moves towards 3.90 and eventually 4.90 USD, with the bullish scenario invalidated only below the 2.80 USD area.
AUD_USD GROWTH AHEAD|LONG|
✅AUD_USD is trading in an
Uptrend and the pair is
Consolidating above the
Horizontal support level
Around 0.6371 and we are
Already seeing a bullish
Rebound from the level
So we are bullish biased
And we will be expecting
The pair to go further
Up this week
LONG🚀
✅Like and subscribe to never miss a new idea!✅
Disclosure: I am part of Trade Nation's Influencer program and receive a monthly fee for using their TradingView charts in my analysis.

ICP/USDT Breakout Potential: Descending Trendline Under PressureThis is the 4-hour chart for ICP/USDT, and it’s showing some interesting action. Over the past few months, ICP has been stuck in a downtrend with a clear descending trendline acting as resistance. However, each time it formed a falling wedge pattern, we saw a breakout to the upside, followed by short rallies.
Right now, the price is hovering around $5.10 and seems to be testing that same long-term trendline again. If it breaks above this level with strong volume, it could be the start of another bullish move. Definitely a chart to keep an eye on for a potential breakout in the coming days.

GBP_CAD BULLISH BREAKOUT|LONG|
✅GBP_CA D made a bullish
Breakout of the falling
Resistance and the breakout
Is confirmed so we are bullish
Biased and after a potential
Pullback we will be expecting
A further bullish move up
LONG🚀
✅Like and subscribe to never miss a new idea!✅
Disclosure: I am part of Trade Nation's Influencer program and receive a monthly fee for using their TradingView charts in my analysis.

GBP-NZD Resistance Ahead! Sell!
Hello,Traders!
GBP-NZD went up sharply
From the support cluster
Below just as I predicted
But now the pair is about
To retest a horizontal resistance
Around 2.2620 from where
A local bearish correction
Will be expected
Sell!
Comment and subscribe to help us grow!
Check out other forecasts below too!
Disclosure: I am part of Trade Nation's Influencer program and receive a monthly fee for using their TradingView charts in my analysis.

AUD-USD Will Keep Growing! Buy!
Hello,Traders!
AUD-USD started the trading
Week with a strong bullish
Move up from the horizontal
Support of 0.6371 while trading
In an uptrend so we are bullish
Biased mid-term and we will
Be expecting a further bullish
Continuation, but its best to
Wait and see how the price
Interacts with the local
Key level of 0.6439 as
We might see a local
Pullback from this supply
Area giving us a better
Entry price for the long
Buy!
Comment and subscribe to help us grow!
Check out other forecasts below too!
Disclosure: I am part of Trade Nation's Influencer program and receive a monthly fee for using their TradingView charts in my analysis.
