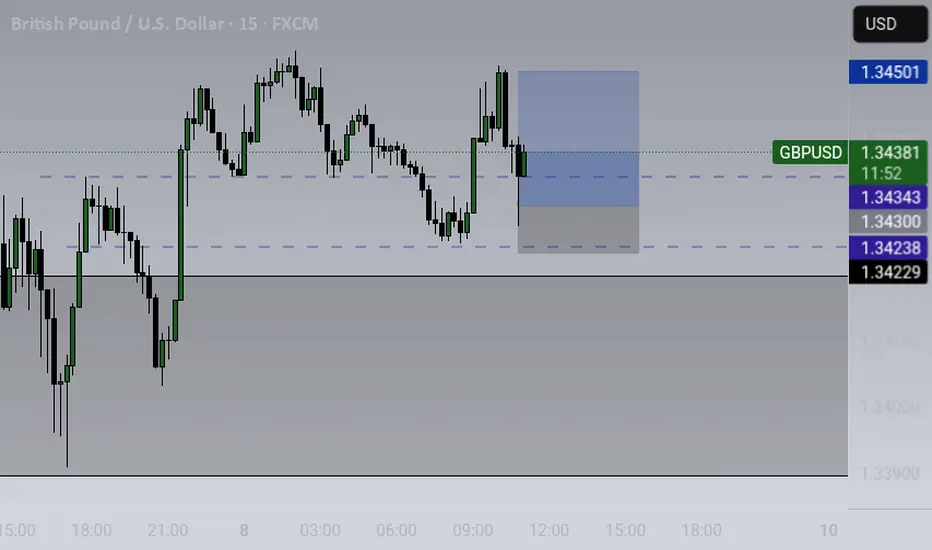
CABLE M15 I'm still anticipating a push to the upside. This entry is based on a reaction on the BISI. I managed to catch the discounted price. With a good 1:3 Risk:Reward.
Ictfvg
What is ICT FVG ? – ICT Fair Value Gap Explained Step by Step !ICT FVG knowns as Fair Value Gap, is a three-candle formation having an un-retraced area between the high and low of 1st and 3rd candlestick.
A fair value gap is indicated by an imbalance and it acts as a level of support and resistance in the price chart.
This blog post will teach you all about the ICT FVG from their formation to identification and their use in trading.
You can jump to the section you are most interested in from below or can continue reading the whole article for better understanding.
Table of Contents
What is ICT FVG (Fair Value Gap)?
How to Identify an ICT Fair Value Gap?
Types of ICT FVG
(I) Bullish Fair Value Gap
(II) Bearish Fair Value Gap
ICT FVG Trading Strategy
Best Time Frame for ICT FVG Identification
Best Pair for ICT FVG Trading
Final Thoughts
What is ICT FVG (Fair Value Gap)?
ICT fair value gap is a three-candle structure indicating a gap between the high and low of 1st and 3rd candlestick.
The gap between three candles is created because price does not retrace in that area and leaves it open.
You can see the example of ICT FVG in the picture below :
ICT FVG acts as a magnet for price and price retrace back to the fair value gap to balance the price delivery.
After retracing to the FVG price then reverses and continues its trend .
How to Identify an ICT Fair Value Gap ?
To identify an ICT FVG, you need to look for a large candlestick with most body range.
After identifying the large candlestick, mark the high of candlestick prior to the large candle and low of the subsequent candlestick .
There will be a visible gap between the high and low of the two candlesticks which indicate the ICT fair value gap .
Types of ICT FVG
On the basis of price move the ICT FVG has two types which are explained below :
(I) Bullish Fair Value Gap
A bullish fair value gap in ICT terms appears during an uptrend with a three-candle pattern.
It happens when the middle candle has a large body , leaving a gap between the high of the first candle and the low of the third candle .
In an uptrend , a fair value gap can serve as strong support, with the price often retracing to fill the gap before moving higher .
You can see the example of bullish fair value gap in the picture below :
(II) Bearish Fair Value Gap
A bearish fair value gap appears in a downtrend within a three-candle pattern.
It forms when the middle candle has a large body, creating a gap between the low of the first candle and the high of the third candle .
In bearish trend a fair value gap can act as a good resistance and mostly price tends to fill this gap before moving lower .
You can see the example of bearish fair value gap in the picture below .
ICT FVG Trading Strategy
To trade using an ICT fair value gap, you need to go through below steps.
Step 1 – Determine Market Trend: First of all we need to identify the market trend of any asset whether it is bullish or bearish.
You can use ICT Daily Bias to anticipate the direction of price move.
In bullish trend price makes higher highs and higher lows, while in bearish trend price makes lower lows and lower highs
Step 2 – Identify Premium and Discount Zone: You would be looking for the premium fair value gap in bearish trend, while in bullish trend you would be looking for discount FVG.
Step 3 – Identify Large Candle:Once you have determined the trend, next step is to find a large candle with large body & small wicks.
If market is in bullish trend, we look for strong bullish candle with most body range while in bearish trend we look for large bearish candle with most body range.
Step 4 – Study Preceding & Proceeding Candles: Once you have identified one large candle, now study the one candle before it & the one candle after it.
Both of these candles should have such a structure that their bodies should not overlap the body of middle candle thus confirming a fair value gap between the wicks of first & third candle.
Step 4 – Mark Fair Value Gap: In bullish trend the gap between the high of first candle and the low of third candle.
While in bearish trend the gap between the low of first candle and the high of third candle will be marked as your fair value gap.
Step 6 – Execute the Trade: If the price is in bullish trend, we will wait for price to retrace and test the discount fair value gap to balance the move.
When price tests the discount fair value gap you can execute a buy trade with other technical confirmations like rejection or structure shift in lower time frame.
In the picture given below you can see price is in bullish trend making higher highs and higher lows.
It retraces back to test the fair value gaps and rejects from the fair value gaps, eventually going higher.
In a bearish trend, you would wait for the price to retrace up and test the premium fair value gap to balance the bearish price delivery.
When the price visits this gap, it can offer sell opportunities, especially when combined with additional confirmations like rejection or a shift in market structure.
In the image below, the market is in a downtrend, forming lower highs and lower lows.
It repeatedly tests bearish fair value gaps and rejects from these levels, leading to further price declines.
Best Time Frame for ICT FVG Identification
ICT FVG can serve different purpose, like it can be used as a tool to find the Daily Bias using higher timeframe like 1-Day.
But if you are using the fair value gap as a PD Array to find trade entry then you would be looking for a fair value gap in lower timeframes like 15-Minutes or lower than that.
Best Pair for ICT FVG Trading
Initially the ICT introduced the fair value gap using the index trading like Nasdaq and S&P-500 and it yielded best results in that market.
After that he demonstrated some examples of forex pairs using the FVG and it was equally good for that market too.
So, now a days ICT FVG serve as a key tool for traders in every market.
Final Thoughts
While trading using a fair value gap we should keep in mind that every fair value gap in the market is not tradeable , to trade using fair value gap, we should use it in conjugation with other strategies like demand & supply or support & resistance . At these levels fair value gaps can act as a more reliable tool to take a trade.
You can also check this article how traders use fair value gap to open the right trade.
Plus to mitigate your risks, you should always trade with stop loss in place as no strategy is foolproof in trading.

INDEX MARKET IS BULLISH According To ICT Concepts Nasdaq & S&P500 Is Bullish
Also Has SMT (Nasdaq Touches IFVG, S&P Touches Daily Bullish FVG. That Means Nasdaq Is Going To Create A Bullish Breaker And S&P Is Going To Create A Bullish Mitigation.)

NQ ELEVATORPUSH NQ is looking bullish to take out the internial liquidity resting above the 50% marked out. This Friday we saw the retracement to the TGIF 30% and I would expect a move up and to create a high of the week on either Tuesday or Wednesday to complete the PO3 and a potential manipulation in the market maker model. Buys were taken this week with the market maker model to secure funding. Expect the liquidity to be taken that' is my main target this week!

08/19/24 NQU2024 Bullish ICT Daily OverviewHere is what I saw on the charts on Monday for the NQU2024 chart. I have labeled exactly where I would get in and out, while also showing where my stop loss would be. This is not trading advice or suggestions to follow, just my interpretation of what price delivered.

#USDCAD 15MINS INTRADAYUSDCAD has been on a sell retracement in days now , so I am looking this level for a short sell scalp , using the ICT & indecent concept for this analysis .
PDH was taken out & I am seeing a sell continuation intent

EURNZD: Second Entry Worth Possible 500 Pips: what do you think?Hey Everyone,
EURNZD with our first buying entry that we had posted that turned out to hitting our Take Profit area, now we are expecting the same similar movement. Price has formed AB=CD pattern. In this scenario, price most of the time create a opposite big movement in our case it can give us a nice bullish impulse, helping us to gain 500 pips at least. There are two entries, first one with a greater risk and second entry is much safer, it is up to you which one to take.

EURCHF: Clean Bullish Move In Process! OANDA:EURCHF in our first published idea on eurchf we had identified a key level and price hit that level successfully and that idea was closed immediately. Now we are looking for swing move as we have strong buying bias and can expect price to fill the liquidity void in longer time frame. What do you think?

XAUUSD: Imbalance filled, What next?$1990 area had to be filled, we previously had identified this 'imbalance level' and have been waiting for price to fill the area so that we can have a clear view. Since price have filled the area. Now we can see price going towards 2020 and then 2050 only if DXY remain week and other economic data support Gold to rise. In other case, price can drop to 1900$ and rebound from there. We will have to wait and see how prices behave.
Good luck and trade safe!

Weekly Trade Review : Entries, Risk Management & PsychologyJoin me in this video as I review the past week's GBPUSD analysis, covering crucial elements like entries, risk management, and psychology . Discover valuable insights into my trading strategies and learn how to navigate the markets with precision and discipline . Whether you're a novice trader or seasoned investor, this video offers essential lessons for mastering the art of trading.
Kind Regards,
The_Architect

GBPUSD Sell Order ContinuationI anticipate further sells on GBPUD, we have rebalanced a H1 FVG and I see a further continuation to draw to the Daily Sell Stops for the day. IPDA has also been engineering liquidity to the downside that we may want to Draw to first, thereafter the Daily Sell Stops will be the next target.
Please refer to my pre-London analysis that will help to justify my first entry for sells.
Kind Regards,
The_Architect

GDP (GBP) Potential Sellside Draw GBPUSDGreetings, the GDP (GBP) is going to be released shortly and my anticipation is a continuation lower for GBPUSD to reach the Daily Sell Stops. Price at the moment has rebalanced a H4 FVG and on the H1 we have a Turtle Soup (False BOS) . The false BOS gives us an idea that IPDA took the high in order for order pairing to occur.
Order Pairing essentially means that IPDA (Interbank Price Delivery Algorithm) is pairing the Buy Stops at that high (Buyside Liquidity) with its Sell Orders. In other words, the algorithm is entering its Sell Orders to the willing buyers that point.
Once Order Pairing has occurred this establishes a High Resistance Liquidity Zone , meaning that the High becomes a Resistance point, because think about it this way. If you were the Institutional Bank, if you had already entered a order up there, why would you deliver price back up there?
Kind Regards,
The_Architect

CPI (GBP) Potential Sellside Draw GBPUSDThe CPI (GBP) is going to be released at 02:00 NY Time today and what I am anticipating is firstly a push into the H4 FVG which on the H1 will result in a Turtle Soup (False Break of Structure). The Key is to note that with draw we move from External Liquidity (Highs/Lows) to Internal Liquidity (FVG's) and versa. If the rebalance does not occur I will react accordingly.
After the H4 FVG is rebalanced I am anticipating a High Volatility Draw to the Daily Sell Stops. In fact what is very important to note is that IPDA (Interbank Price Delivery Algorithm) is running a bit late and the Daily Price 1.23740 has to be reached within the next 12 Days.
Concerning the Long Term Sellside Narrative, refer to my GBPUSD Long-term Draw analysis below.
King Regards,
The_Archi-tect

CPI Potential Sellside Draw GBPUSDCPI Draw will possibly be to the downside where I am expecting high volatility to seek the Daily Sell Stops. I will be waiting for the CPI news to drop and react afterwards.
Regards,
The_Architect

ICT Long setup EURNZD, intraday🚩 SB AI New Signal Notification
Release time:2024/1/9 1300
Strategy: Daytrade scalping
Chart:EURNZD
Direction:ICT Long setup
Price:Buy Limit orders near the FVG,Demand Zone, Stop loss and TP levels.
Reference~
Buy Zone 1.7504 to 1.7516
Target at Key levels 1.7542 and 1.7571
Stop loss below 1.7495
#SB signals #New strategy #Forex #EURNZD #Daytrade #Scalping #Freedom trading style #Easy trading #Copy and earn #Zero learning curve

EURUSD Weekly Idea - 17/12/2023EURUSD left equal highs around 1.10173, price will likely take the buy stops after closing the fair value gap between 1.088 and 1.083 or it can stops at the 50% of the fair value gap which is 1.085.

Crypto Currency Trading Made Easy: Follow Our Buy Limit Orders 🚩 New Signal Notification
Release time: 2023/12/15
Currency: ETHUSDT
Direction: Long
Price : Buy Limit order Levels and Target levels * please refer to the chart attached

What is ICT Power of 3?Power of 3 at work on Gold producing a 8.6RR move on 30/06/2023
FOREXCOM:XAUUSD
Ict power of 3 is a strategy that reveal the market maker algorithm model for price delivery.
Power of 3 simply means there are 3 things market makers algorithm do with price in ever trading days.
Those 3 things are; Accumulation, Manipulation and Distribution.
AMD:
A: Accumulation
M: Manipulation
D: Distribution
1. Accumulation: They accumulate liquidity through the delivery of a ranging market.
The purpose for delivering a ranging market is to induce both buyers and sellers to enter the market thinking that price will go in their direction.
2. Manipulation: After accumulating both buying and sell orders, they then manipulate the market to further induce another set of traders which are breakout traders.
But, that particular manipulation move is not their intended direction for the day. They only use it to gather liquidity, Which will then lead them to the next action which is to move and distribute price in their real direction for the day.
3. Distribution: After manipulating price to a particular direction different from their plan, they then distribute price to their original intended direction.
e.g to buy, they will first sell the market and then buy at the discount price level.
Example of Power of 3 on Gold
AMD:
A: Accumulation
M: Manipulation
D: Distribution
Accumulation : Price range during Asian session, accumulating liquidity on both sides of long and shorts.
Manipulation : Price broke the low of the accumulation during London session to take out sell side liquidity and then fill the previous day imbalance.
Distribution : Price move away from the FVG leading to a shift in market structure on 5m time frame, plus a short pull back, follow by a massive move to the upside during the New York session to take out buy side liquidity above.

GBPUSDPrice Accumulating higher as of this upcoming week, as we wait for buyers to trigger high time frame key levels to be taken out before sellers dominated in mid weeks price decline.

S&PUS500 BULLISH HUNTExpecting a bullish movement on FVG after short retracement after taking out stop hunts

Nifty on daily chart - ShortNifty daily chart as per ICT prospective:
For swing trading prospective Nifty is in downtrend on daily chart and will face tough resistance in the zone of 19550 till 19900. Hence while Nifty is in 19550-19900 expect consolidation and bias towards down. The long term trend would turn positive ONLY above 19900. Till that time it is sell on rise.

EUR USD SILVER BULLETBuy setup on eurusd occurs everyday during the ICT Silver bullet session on the London as Well as the NewYork trading session.
Here we can see the price broke below the Asian Rage Lows and giving us a OTE after breaking the asian rage discount range the price gave us OTE on the 5min timeframe. The TP was set at the BuySideLiquidity (BSL).

GBPUSD 08/07-11 WKLY OUTLOOKBLACKBULL:GBPUSD
Time Frame H1
- Price is at a H1 - OB
- Looking for price to fill FVG that was created by NFP
Outlook 👁️🗨️
Have ours eyes set out price to retrace back into a discounted PDA
1.2713-1.2728
how the zone was created, with the fib tool (most recent swing high to swing low)
