EURJPY: Rejection Block Support Fuels Bullish momentum!Greetings Traders,
In today’s analysis of EURJPY, recent price action confirms the presence of bullish institutional order flow. As a result, we aim to align ourselves with this directional bias by seeking high-probability buying opportunities that target the long-term highs, where a significant liquidity pool resides.
Key Observations:
Weekly Timeframe Insight:
Last week, price retraced into a weekly bullish Fair Value Gap (FVG), which has acted as a strong support zone. This reaction has initiated a bullish response across lower timeframes, validating the weekly FVG as a meaningful area of institutional demand.
H4 Bullish Market Structure Shift:
Following the weekly bounce, the H4 chart presented a clear bullish Market Structure Shift (MSS), signaling the onset of upward momentum. Price then retraced into an extreme discount, where it found support at a well-defined Rejection Block—an institutional array we expect to hold as a launchpad for further bullish continuation.
Trading Plan:
Entry Strategy:
Monitor the Rejection Block zone for bullish confirmation setups on lower timeframes (M15 and below) to validate potential long entries.
Target Objective:
The draw on liquidity remains at higher premium levels, with the liquidity pool above the long-term highs serving as our primary objective.
For a detailed market walkthrough and in-depth execution zones, be sure to watch this week’s Forex Market Breakdown:
As always, exercise patience, wait for confirmation, and maintain strict risk management.
Kind regards,
The Architect 🏛️📈
Ictorderblock

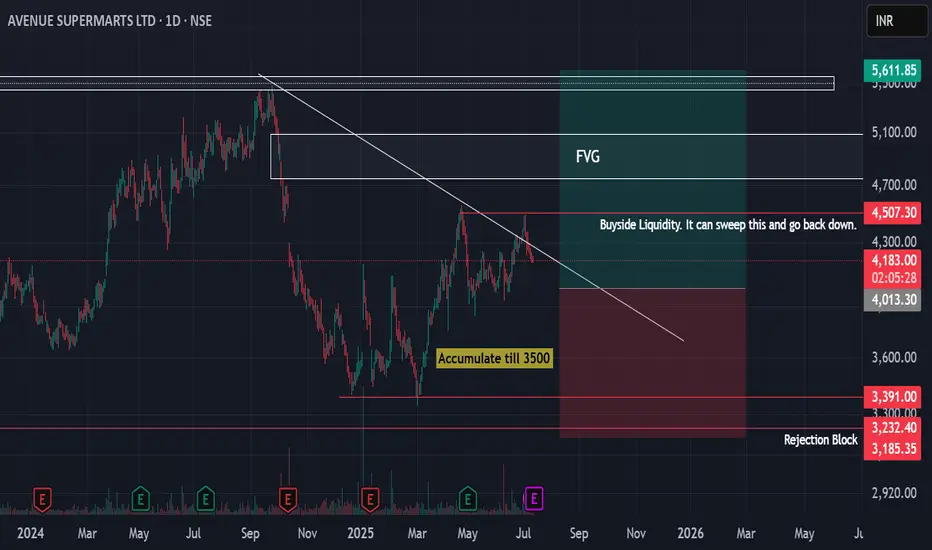
DMART Looking for some upside if everything goes smoothIn the short term, we can see a sweep of the buyside liquidity which has been marked.
For a longer term - atleast a year - one can accumulate for 5400-500 or higher levels.
A rejection block has been marked in case things go south
EURAUD: Possible Swing Movement of 660 pips expected! FX:EURAUD on daily candles of last few days breakthrough and now dropping back to demand zone where we expect price to bounce strongly and at least we expect target one to accomplished by end of January. While target two and three remain a long away from our current price area. Stop Loss should be below the strong wick of daily candle.
From fundamentals side AUD will be weaken and EURO can be bullish for next few months, taking entry will require a strict risk management as this is a swing trade, do not expect to achieve the target in couple of hours or days.
Good luck and trade safe.

?BTC Intraday LongsTechnical analysis using ICT concepts.
A rally below the 12 am NY opening price to raid sell stops below previous day's Asian & London session.
CISD from a Bullish orderblock formed on Thursday NY am session.
Looking for Buy stops resting above Friday's highs.
* Note A 4hour BISI is below the reference range that could still be revisited.

What is ICT Order Block and How to Trade it
👉🏻 ICT order block is basically an area on the price chart which indicates the huge institutional orders and signals the strong reversal or continuation of price.
You can use the order block as a confirmation of your trade entry or for the reversal of price.
In this article, we will teach you all about order block trading strategy from definition to its identification and to use along with examples.
You can jump to the part of this guide, you are most interested in or you can continue reading the whole article :
Table of Contents 👇🏻
1 : What is ICT Order Block?
2 : Types of Order Block
3 : Bullish Order Block
4 : Bearish Order Block
5 : Bullish Order Block Trading Strategy
6 : Bearish Order Block Trading Strategy
7 : Final Thoughts
What is ICT Order Block? ⚡️
ICT Order block is the area in the price chart, where a large number of orders are executed by institutional traders in the market and market shows sudden strong move from that area.
Retail traders follow institutional foot prints, so they wait for these order block zones to buy or sell in the market & make profit along with big institutions like banks.
You can see the example of order blocks in the picture given below :
Types of Order Block
As you know market has two price moves bullish & bearish. So on the basis of price moves, order block is divided into two types.
(I) Bullish Order Block
(II) Bearish Order Block
Bullish Order Block
A bullish order block is the last bearish candle before the bullish impulse (strong sudden) move, it typically consist of two candles, with the first candlestick being a bearish and the second candlestick being a bullish one.
How to Identify a Bullish Order Block? ⚡️
To identify a valid bullish order block you need to check following things.
(I) Second candle being a bullish candle, should grab the low of previous bearish candle. Price should go below the low of previous bearish candle.
(II) Second candle being a Bullish candle should close above the high of previous bearish candle.
(III) Imbalance in lower time frame in the order block zone.
(IV) Structure shift in lower timeframe.
To sum it up we can say, second candle should completely engulf the first candle – body to body & wick to wick.
You can see the example of bullish order block in the picture below :
Bearish Order Block ⚡️
A bearish order block is the last bullish candle before the bearish impulse move, it typically consist of two candles, with the first candlestick being a bullish and the second candlestick being a bearish one.
How to Identify a Bearish Order Block? ⚡️
To identify a valid bearish order block you need to check following things.
(I) Second candle being a bearish candle, should grab the high of previous bullish candle. Price should go above the high of previous bearish candle.
(II) Second candle being a bearish candle should close below the low of previous bullish candle.
(III) Imbalance in lower timeframe in the order block zone.
(IV) ICT Market Structure Shift in lower timeframe.
To sum it up we can say second candle should completely engulf the first candle – body to body & wick to wick.
You can see the example of bearish order block in the picture below :
Bullish Order Block Trading Strategy ⚡️
In bullish order block trading strategy you would look for shift of price delivery from bearish to bullish and then execute a buy trade utilizing a bullish order block.
When the trend is bearish and it approaches a demand zone where you would seek reversal of price and at that area price shifts its structure to the buy-side.
Then you will be looking for the order block at the bottom of the impulse move which changed market trend.
When you find the bullish order block in that move, it means it was a move involving institutions so you need to wait for the price to test the bullish order block zone to execute a buy trade.
When price retraces back and tests the bullish order block zone you can execute a buy trade as shown in the picture below :
When tradin bullish Order block trading strategy your stop loss will be 10/20 pips below the low of order block zone.
Bearish Order Block Trading Strategy ⚡️
In bearish order block trading strategy you would be looking for the shift of trend from bullish to bearish and then execute a sell trade utilizing a bearish order block.
When market trend is bullish and it approaches a supply zone where you seek reversal of price and at that area price shifts its structure to the sell-side.
Then you would look for the order block at the bottom of the impulse move which changed price trend.
When you find a bearish order block in that move it means it was a move involving institutions so you need to wait for the price to test the bearish order block zone to execute a sell trade.
When price retrace back and tests the bearish order block zone you can execute a sell trade.
A real market example of bearish order block trading strategy is shown below in the picture.
Final Thoughts⚡️
When trading using bearish Order block trading strategy our stop loss will be 10/20 pips above the high of order block zone.
Order blocks can also be found in a trend after a pull back and these order blocks confirm the strength of trend. We can use these order blocks to trade the trend or to add new positions in the trend.
Like in a bearish trend after a bullish pullback a bearish order block may form, which confirms the strength of bearish trend and we can add a new sell order to enjoy the bearish trend.
Likewise in a bullish trend after a bearish pullback a bullish Order block may form which confirms the strength of bullish trend and we can add a new buy order to enjoy the bullish trend ❤️ .

AUDUSD BUYFundamentally we should see this push up for next coming days, this can get tense but am confident the top down technical analysis.


AUDUSD "LONG" IDEA (SMC - ICT)On the following chart we have a possible movement of the price upwards.
- We swept internal liquidity (IRL) on HTF
- We made a Market Structure Shift (MSS) on 1H
- However we left some Imbalanced (IMB) area below which can possible mean we made an Inducement (IDM).
I might get into buy's right on Fibonacci Optimal Trade Entry (OTE) level with 1% of my balance.
If we go lower. Will wait for another Confirmation Entry (CE)


GBPJPY - Short idea.GBPJPY - Short day trade idea.
PDH Liq, Orderflow, OB --> OB + FVG, Liq to target.


ICT Long setup on NZDCAD👋Hello Traders,
Our 🖥️ AI system detected that there is an H1 or higher timeframe ICT Long setup in
NZDCAs for session trade (a couple of hours)
Here is a session trade idea (since it is near support surface, we should use small lot size)
Please refer to the details Stop loss, Buy Zone,open for take profit.
For more ideas, you are welcome to visit our profile in tradingview.
Have a good day!
Please give this post a like if you like this kind of simple idea, your feedback will bring our signal to next better level, thanks for support!

ICT Concepts Nasdaq Weekly Bias is Bearish 14/18 Oct 2024Smart Money Concepts Used ICT 2022 Mentorship and Core Content Weekly Index Market is Bearish. It Is Not Investment Advice. Its All up to Your Experience And Risk Management

EUR BULLISH Twice hit bullish breakers to bounce been a long time coming to take these highs after a year of consolidation . Up and coming news next week should favor this idea!

EURAUD Possible next movePrice currently rests on an OB we will wait for the markets to open on monday and see if it gives us confirmation. If not, we expect it to reverse on the FVG and give us a clean drop

EURUSD Swing ideaTaking into consideration that DXY index is bearish fundamentally and technically, And since EURUSD is heavily correlated with DXY inversely which means we are bullish on Euro.
Technically :
Euro was in correction for the last week or so, But this changed yesterday and extra confirmations landed today on the charts and fundamentally.
We touched the weekly FVG and changed the trend direction after that leaving FVG in the discount zone and it present an ideal area to go long targeting old highs at least.
Now expecting the price to correct toward the entry zone to take off again.
I will update here once we reach entry to look for more confirmations in lower time frames.

XAUUSD Short ( High Probabilitie )The market structure is bearish on 15m tf and is aiming for the weekly FVG below, Once we get to the weekly FVG will look for buying opportunities, But for now the setup has a very good probabilities to succeed .

USDCAD Short and SouthThe USDCAD currency pair may weaken because the possibility of the Fed cutting interest rates in September looks promising, while on the other hand, the BOC seems to be reaching its inflation target close to 2%.
Market participants view the BOC as quite capable of controlling inflation. However, both currencies are quite sensitive to crude oil prices.
The reason I see a risk of decline in the USDCAD pair is from the CAD side, which could potentially strengthen slightly because crude oil prices might rise, especially with the OPEC+ production cut announcement.
Since CAD has an 80% correlation with crude oil, they tend to move in the same direction.
If crude oil strengthens, the demand for CAD will also increase.
Sell USDCAD.
Sell Limit : 1.37100
Stoploss : 1.37600
Take Profit : 1.33100
