USDCAD (4H) backtest : 58% Win rate (11.25 R), 92% non-losers!Detailed backtest results
prnt.sc
Win/Loss ratio : 700%
Non losers : 92%
Net R : 11.25 R across 12 trades
Avg R / winner = 1.61
Avg R / trade = 0.94
Icons on the chart
Thumbs up : Trade was a win
Thumbs down : Trade was a loss
Circle with a cross : Trade was breakeven
Cross : Did not take the trade due to one or more trade qualifiers
Bug : I could not understand how to trade, do avoided trading
Trade qualifiers
$ icon : DXY was either supporting the trade direction (and we took the trade as win/loss/BE), or DXY was not supporting the trade direction (and trade was not taken)
Dollar bill icon : Liquidity was present behind the stop loss
Strategy
Wait for market structure to break, then trade the retest of that zone. Zone is drawn using the first candle which crossed the pivot high/low to begin trapping the traders
AND
Liquidity in form of equal highs/lows should not be present behind the stop loss
AND
Since the pair is highly correlated to DXY , the formation of HH/LL in DXY should support the trade's direction at the time of zone's formation
Risk management
Reduce 50% at 1R => Trade becomes risk free
Reduce further 25% at 2R AND move SL to break-even
Close trade at 3R
Winner = 1.75R
Variables
Avg winner = 1.75R
PS : Please excuse the busy chart!
Ictorderblock

EURUSD (4H) backtest : 69% Win rate (12.75 R)Detailed backtest results
prnt.sc
Win/Loss ratio : 300%
Net R : 12.75 R across 13 trades
Avg R / trade = 0.98
Avg R / winner = 1.42
Icons on the chart
Thumbs up : Trade was a win
Thumbs down : Trade was a loss
Circle with a cross : Trade was breakeven
Cross : Did not take the trade due to one or more trade qualifiers
Bug : I could not understand how to trade, do avoided trading
Trade qualifiers
$ icon : DXY was either supporting the trade direction (and we took the trade as win/loss/BE), or DXY was not supporting the trade direction (and trade was not taken)
Dollar bill icon : Liquidity was present behind the stop loss
Strategy
Wait for market structure to break, then trade the retest of that zone. Zone is drawn using the first candle which crossed the pivot high/low to begin trapping the traders
AND
Liquidity in form of equal highs/lows should not be present behind the stop loss
AND
Since the pair is highly correlated to DXY, the formation of HH/LL in DXY should support the trade's direction at the time of zone's formation
Risk management
Reduce 50% at 1R => Trade becomes risk free
Reduce further 25% at 2R AND move SL to break-even
Close trade at 3R
Winner = 1.75R
Variables
Avg winner = 1.75R
PS : Please excuse the busy chart!

My two $EURUSD Sell Limits Same as I had earlier this morning. The Asian session solidified my thoughts. Having two positions just in case it retraces deeper than first thought. See related chart for this mornings idea on the pair. Also sometimes you need to break down to the 5 MIN and 1 MIN chart for specific price action movements for these determinations but still using the daily chart as my overall directional bias. I place the fib on the bodies of the candles in the 5 min chart, wicks can differ wildly depending on broker. This gives you the best accurate reading of the chart from a fib standpoint if you want to enter at 62% or 71.5%.

$EURUSD Short - Pulling Back For Another SellI have two depictions as to what could happen and one may have already happened but I don't think so. It has barely touched the 15 minute order block for it to be selling already and there's too much movement in the 5 min chart that Il'll show here.
There are two 5 min order blocks that price could reach before returning lower. The first around 1.8305 and the second around 1.8412. This could used to add another position to a swing sell I have that related to this idea (which is why you see the TP1 running through the middle of my charts) or it can be a quick 20-30 pip scalp. depend on which position you choose and which it actually goes to.
it appears to be enticing buyers with a stop loss but I don't think that's all it's doing is trying to attract buyers.
Fingers Crossed.


GICHSGFIN (4H) Backtest : 69% win rate across 13 trades => 11.4 Detailed backtest result : prnt.sc
Non-looser = 77%
Icons on the chart
Thumbs up : Trade was a win
Thumbs down : Trade was a loss
Circle with a cross : Trade was breakeven
Cross : Did not take the trade due to presence of liquidity (equal highs/lows) behind the stop loss
Variables
Avg winner = 1.6R
Strategy : wait for market structure break, then trade the retest of that zone. Zone is drawn using the first candle which crossed the pivot high/low to begin trapping the traders.

USDCHF (4H) Backtest : 60% win rate across 20 trades => 14.2 RDetailed backtest result : prnt.sc
Non-looser = 75%
Icons on the chart
Thumbs up : Trade was a win
Thumbs down : Trade was a loss
Circle with a cross : Trade was breakeven
Cross : Did not take the trade due to presence of liquidity (equal highs/lows) behind the stop loss
Variables
Avg winner = 1.6R
Strategy : wait for market structure break, then trade the retest of that zone. Zone is drawn using the first candle which crossed the pivot high/low to begin trapping the traders.

RUSSEL (4H) Backtest : 68% win rate across 19 trades => 17.8 RDetailed backtest result : prnt.sc
Non-looser = 84%
Icons on the chart
Thumbs up : Trade was a win
Thumbs down : Trade was a loss
Circle with a cross : Trade was breakeven
Cross : Did not take the trade due to presence of liquidity (equal highs/lows) behind the stop loss
Variables
Avg winner = 1.6R
Strategy : wait for market structure break, then trade the retest of that zone. Zone is drawn using the first candle which crossed the pivot high/low to begin trapping the traders.

USDCAD (4H) Backtest : 55% win rate across 22 trades => 12.2 RDetailed backtest result : prnt.sc
Non-looser = 68%
Icons on the chart
Thumbs up : Trade was a win
Thumbs down : Trade was a loss
Circle with a cross : Trade was breakeven
Cross : Did not take the trade due to presence of liquidity (equal highs/lows) behind the stop loss
Variables
Avg winner = 1.6R
Strategy : wait for market structure break, then trade the retest of that zone. Zone is drawn using the first candle which crossed the pivot high/low to begin trapping the traders.

GOLD (4H) Backtest : 78% win rate across 18 trades => 21.4 RBacktest results : prnt.sc
Non-looser = 94%
Icons on the chart
Thumbs up : Trade was a win
Thumbs down : Trade was a loss
Circle with a cross : Trade was breakeven
Cross : Did not take the trade due to presence of liquidity (equal highs/lows) behind the stop loss
Variables
Avg winner = 1.6R
Strategy : wait for market structure break, then trade the retest of that zone. Zone is drawn using the first candle which crossed the pivot high/low to begin trapping the traders.

DXY (Dollar Index) 4H : Trapped sellers waiting to exitThere are a whole bunch of sellers trapped in a fake move below old monthly low's - who would love to exit when price comes back to them - giving us a beautiful long entry.


EURGBP (4H) Backtest : 48% win rate across 21 trades => 10 RBacktest results : prnt.sc
Non-looser = 71%
Icons on the chart
Thumbs up : Trade was a win
Thumbs down : Trade was a loss
Circle with a cross : Trade was breakeven
Cross : Did not take the trade due to presence of liquidity (equal highs/lows) behind the stop loss
Variables
Avg winner = 1.6R
Strategy : wait for market structure break, then trade the retest of that zone. Zone is drawn using the first candle which crossed the pivot high/low to trap the traders.


USDJPY (4H) : Trapped sellers zone : Active tradeTrapped sellers == long position
Close all position at 3R as there's a trapped buyers zone just above it.

NZDUSD (4H) : 2 zones of trapped buyers => SHORTBuyers are stuck in two pivotal locations. When price comes back to them, they would want to exit, giving us a nice SHORT opportunity!
For now, simply wait.

USDMXN (4H) Backtest : 61% win rate across 23 trades => 15.4 RBacktest results : prnt.sc
Icons on the chart
Thumbs up : Trade was a win
Thumbs down : Trade was a loss
Circle with a cross : Trade was breakeven
Cross : Did not take the trade due to presence of liquidity (equal highs/lows) behind the stop loss
Variables
Avg winner = 1.6R
Strategy : wait for market structure break, then trade the retest of that zone. Zone is drawn using the first candle which crossed the pivot high/low to trap the traders.

USDJPY (4H) : Trapped buyers zoneTrapped buyers on USDJPY in a fakeout. Wait for price to come back to them, they would love an exit : giving us a wonderful short opportunity!

EURUSD (4H) : Trapped trader zones (long & short)EURUSD has trapped traders on either end of the range - who would love to exit when price reaches them.
All we have to do, is to just wait :)

THE GOLD OTE MISSEDWITH PATIENCE WE WOULD CAUGHT THIS BEAUTIFUL OTE ON GOLD WHICH WOULD BE A HELL OF A TRADE AND EXECUTION.


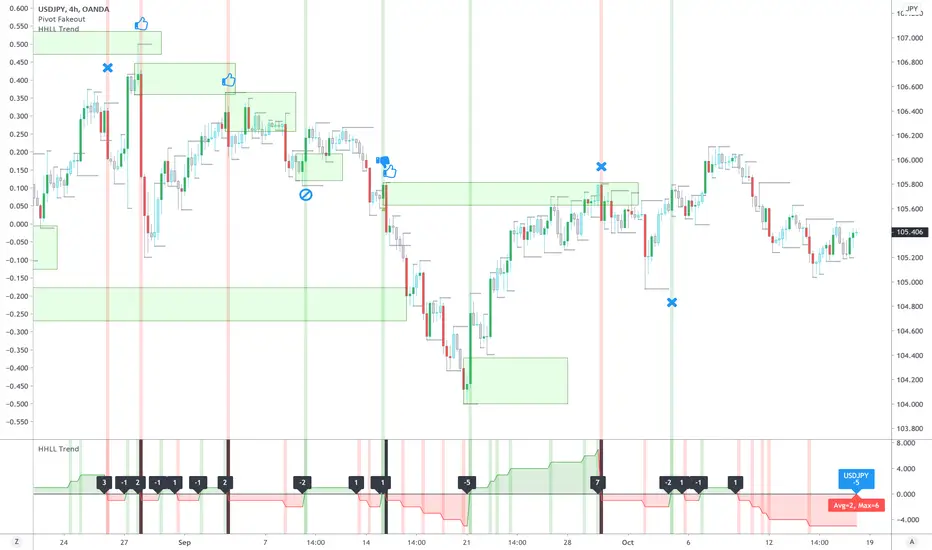
USDJPY (4H) Backtest : 67% win rate across 24 trades => 19.6 RBacktest results : prnt.sc
Icons on the chart
Thumbs up : Trade was a win
Thumbs down : Trade was a loss
Circle with a cross : Trade was breakeven
Cross : Did not take the trade due to presence of liquidity (equal highs/lows) behind the stop loss
Variables
Avg winner = 1.6R
Strategy : wait for market structure break, then trade the retest of that zone. Zone is drawn using the first candle which crossed the pivot high/low to trap the traders.