ICXUSDT a big bullish setupHey friends, hope you are well and welcome to the update on ICON (ICX) coin.
Long term up-channel:
The price action is moving in a long-term up channel on weekly chart and reached at the resistance. Candlesticks also having good supports of EMA 10 and 21 as well.
Support and resistance levels and SMAs:
The price action of ICX coin is rejected by $0.65 resistance level and moving between $0.55 to $0.65 support and resistance level. If the price action will break out the $0.65 resistance then on long-term there is not significant resistance up to $2.40. The price action also has good support of SMAs with the time period of 25, 50 and, 100.
Simple moving averages on daily chart:
Simple moving averages on daily chart, with the time period of 25, 50, 100 and, 200 are moving above the price action of ICON and 25 SMA is likely to cross down the price action.
Ichimoku cloud:
On the long-term weekly chart, the price action had a powerful resistance of Ichimoku bearish cloud but now the cloud is turned bullish, so now the priceline may break out this bullish cloud.
This move can be like Ethereum when the price action of ETH found weak resistance of Ichimoku cloud on the weekly chart, then it broke out this cloud with powerful bullish divergence.
Conclusion:
Even though on long-term the price action of ICON is having strong resistance of an up-channel but from small to long-term the priceline of ICX is turning bullish . Once the channel on the channel on the weekly chart will be broken out then the priceline may start a powerful bull run soon.
For exact buy and sell targets for this trade, and other harmonic trading signals you can join:
www.patreon.com
Icx

AMB buying opportunity (LONG position)RSI oversold on 1W. Good time to go long. Unless there is something fundamentally wrong with this project.... As you can see there is a lot of room for growth, just zoom out.


ICX/USDT ICX/USDT Fast with low rest
place your buy order at 0.47-0.464
Sell at 0.66-0.7
Stop 1H close below 0.463

Icon (ICX) Weekly Chart | Falling Wedge | TargetsLet's compare the left side to the right side of the ICXBTC (Icon) chart... What do you see?
We have, to the left first, a falling wedge that was followed by a 390%+ bullish wave.
We have, to the right, a falling wedge that is likely to be followed by another bullish wave...
This is how the markets work.
They move in cycles/waves.
It goes up and down, up and down...
It is going DOWN...
It is time to go UP!
Namaste.

ICX a big parabolic move expectedHey friends, hope you are well and welcome to the new update on ICX coin.
Previously I shared two ideas of ICX with you, one was a formation of Cypher pattern in USD marker and the other was the formation of bullish Shark pattern in the Bitcoin market.
The price action of Icon coin turned bullish in USD market and produced more than 100% profit rally sofar. In the meanwhile, it has also completed the final leg of bullish Shark in the Bitcoin market.
ICX with USD pair Cypher move:
ICX with BTC pair move:
An up channel formation and EMAs:
On the long-term weekly chart, in US dollar market the price action of ICX coin has formed an up channel and also using exponential moving averages with the time period of 10 and 21 as support. This time the EMAs 10 and 21 have just formed a bull cross and the priceline is turned bullish.
Different support and resistance levels:
On the long term weekly chart, the priceline of ICX has broken out the $0.46 and $0.55 resistance levels and trying to break out the key level resistance of $0.65. If the $0.65 resistance level will be broken out then there is no significant resistance that can be found up to $2.39 as per the Binance exchange. Therefore it is possible that once the price action will break out the $0.65 then it will also break out the resistance of an up-channel that has been formed on the weekly chart.
Alligator mouth and a parabolic move:
On the long-term weekly chart, the simple moving averages with the time period of 25, 50, and 100 have formed an opened alligator’s mouth and lifting the price action to the upside. This move is turning parabolic now.
Similar parabolic move expected like XLM:
The same parabolic move can be seen in the XLM chart as well, therefore we can expect that now the price action of ICX will turn more strong parabolic bullish like XLM to lead the altcoins bull run.
Conclusion:
As the price action of Icon coin has already turned bullish in the USD market but it can turn more bullish as it has just completed a big bullish Shark move in the Bitcoin market.


icxusdt longBINANCE:ICXUSDT
My good friends, hello, I am Mustafa (Mr.MB), I hope you are always healthy, happy and profitable.
my dear friends
I have been following the icx currency for a long time to give me a point of entry and this price should be a pullback to the blue or green area and then the bomb.
I hope I can help you the least.

ICX Moon Soon? Wyckoff Spring 4th janICX gunna mooooon soon. Classic Wyckoff accumulation range. Weekly Bull Div. When this moons the USDT pair is going to go bananas. Pooomp it.

ICX Showing Reversal SignsIcx looks like it wants to do a move. Enter near to ema-50 or in a small pullback from here

ICX Long Term FractalBased on the idea that ethereum could hit a price point of $9,000 - $12,000. If the icx/eth ratio gets to similar levels as the last crypto market cycle, then I think icx could hit a price level of $100+ on a spike.

ICXUSDT (falling Wedge Breakout)#ICXUSDT Technical Analysis Update
Falling Wedge Breakout
ICX/USDT currently trading at $0.452
LONG ENTRY level: $0.450 to $0.456
STOP LOSS: below 0.428
Target 1: $ 0.4735
Target 2: $0.4980
Max leverage: 4X
ALWAYS KEEP STOP LOSS...
Follow our Tradingview Account for more Technical Analysis Update, | Like, Share and Comment your thoughts.

✳️ICON/USDT Analysis (23/12) #ICX $ICXICX is still having difficulty breaking up at higher price levels because of its selling force is still strong.
0.35$ zone is still a reliable support zone so we could buy if ICX approaches this zone.
I think, ICX will initiate an uptrend in early January to 0.5$ and 0.65$ or even 1$ zones in early February.
📈BUY- LONG
-Buy: 0.34-0.36$.SL if B
-Buy: 0.49-0.51$ if A.SL if B
📉SELL-SHORT
-Sell: 0.64-0.66$.SL if A
-Sell: 0.95-1$.SL if A
♻️BACK-UP
-Sell: 0.34-0.36$ if B.SL if A
-Buy: 0.19-0.21$.SL if B
❓Details
Condition A : "If 1D candle closes ABOVE this zone"
Condition B : "If 1D candle closes BELOW this zone"


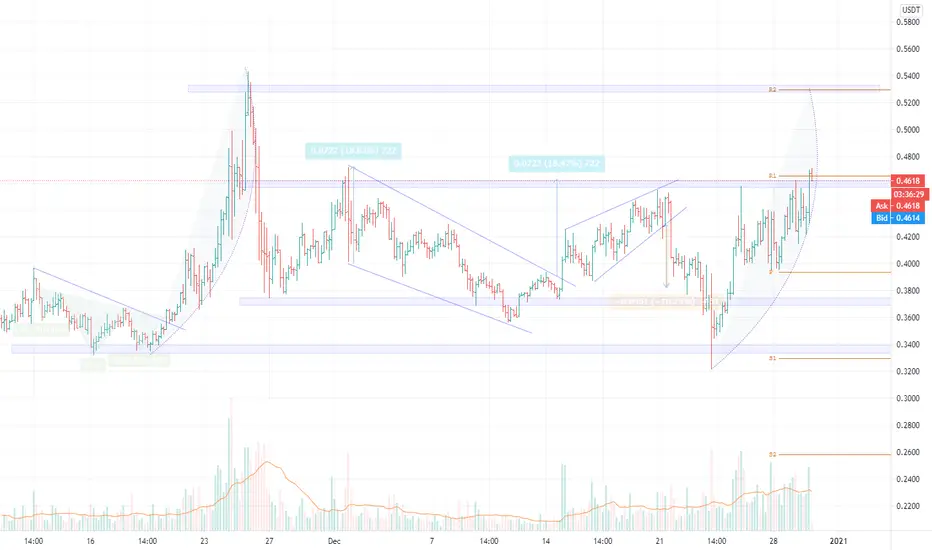
$ICXUSDT a bit of pull back then heading for 0.54c $ICX $BTC$ICXUSDT a bit of pull back then heading for 0.54c $ICX $BTC
Projection for ICX - Alt Season (?)ICX has been doing good groundwork the past months and is on course for key releases in 2021. Good HODL

ICX about to do something.expect a Parabolic Move, Above ($0.46).
($0.46) a Resistance level Since April 2019.
$ICX/BTC Pair has bounced from one-Year lows.

ICON - Next Moon Soon!Hi,
Everything is on the chart. ICON is one of my favorite asset because of its fantastic potential and I would like to share my little point of view about it.
Wave 2 should be over (in orange color). We draw a huge beautiful ascending triangle and we compress more and more.
The shareholders' capital still keep on to strengthen.
We should easily hit the TARGET 1 and 2 during the next months (maybe weeks).
It's a long for me!
Trade safe and not with your emotions...!
Cheers,
PS: it's not a Financial Advice.

Icon LongIt looks like its time to start loading up spot positions in icon. Not sure what the project has done in the last couple years but the chart looks good.

ICX Breakout Setup | Head and ShouldersHead and shoulders breakout may happen any Buy the retest of the breakout at 0.44 - 0.445 USDT


buy and stake it asapThe daily shows a bullflag / accumulation since inception in 2017 and the 5min is showing a reclaim of a previous resistance levels ready to break its bearishness
number only go up from here imo
