Icxlong

ICXUSDT Pump Coming?ICX break the downtrend line and retested it. The coin tested the major support zone and bounced back. This is a good buy for the next few days and will give handsome profits.
Buy Zone: $0.36-$0.38
Target: $0.42- $0.45 - $0.50 - $0.55 - $0.65 - $0.80
Stop Loss: $0.33

ICX: Long Term Outlook Is Fantastic - Possible 300%+ TradeIcon (ICX) has been doing incredibly well respecting support levels. But it seems like demand has been racking up with higher lows being created, meaning that with each retrace, people are seeing more opportunities to buy ICX before support even reaches. A technical higher low is a very bullish sign on the weekly. We can be potentially looking for a massive breakout within the upcoming months, and this may be no better time to accumulate.
Trade Safe.
X Force provides quality content provided by experienced traders who would like to make charting more simple for the general public. If you love our content, please make sure to give us a 'like', we would highly appreciate it!


ICX Bullish scenario Short - Mid Term (4h)4h Chart with short - mid term targets
Bullish on LFT2 and new consensus reward system!
Chart explains itself.
Check 1d chart here:
Not financial advice, just my idea.

Looks like ICX got a long journey!We will have 2 entries, the first one from the 2/1 Gann trend line, the other one from the drawn support (white lines)
Stop : 2x 4H Candle closes below the support (un-separated with a reversal candle)
Target : the red line
Enjoy ^^

ICX long6 R trade at least
entry: 0.00004099 (now)
stop: 0.00003860
target: 0.00005550
i will look to manage trade, take profit, adjust stop around 0.00004500
also, not closing 100% at target. too many big pumps in the market right now to not leave some position to ride one.
UIOGD - JMJ
Travis

ICXUSDT another bull run is on the way!Enter from the green box
SL : 0.3050 or 2x 4H Candle closes below the support trends and horizontal (un-separated by a reversal candle)
Target : 0.919 ^_^

UPDATE: 06/02/2020 #ICX Icon forecast for the coming period!UPDATE: 06/02/2020 #ICX Icon forecast for the coming period!

Another DBL bottom revealing a LONG on ICXUSD
Burkowski performing a hat-trick as double bottoms are popping up left & right on both short and mid/long positions for several different pairings on many different coins & tokens.
In this case; we have $ICXUSD; with BB, KC, VOL, 50 day MACD/SDMA & EMA{25/50} all indicating a clear GO for entry & those with patience will be rewarded with a 26+% almost guarantee* in $ROI.
This is a low risk high reward type trade though I should put some emphasis on the patience required for this signal as those who after nothing but quick profits should steer clear from this entry yet those into bigger positions with less vol/priceaction & more stability > volatility can bank on ICX to pull through with its solid roadmap, excellent team of devs/advisors & a great whitepaper which I highly recommend you read; on all tokens/coins you take positions on..afterall, you wouldn't buy a product/service without knowing what exactly it does and what it plans to do, would you? if so then you're not very wise...
With that being said; the figures for the LONG ICXUSD position are as follows:
TARGET @ 0.2090
STOP @ 0.1505
*DISCLAIMER
Not financial advise-- nothing is guaranteed in this cryptogame; though ICXUSD is IMHO (for what its worth) is well within the buy-zone as it has bottomed and its roadmap indicates some major news/rumor will spring this token into action and bring its parabolic gains to atleast 25%+ though I need to emphasize; this is strictly personal conjecture and not financial advise whatsoever.

ICXBTC poised for a big move up - Bullish CrabTrade Recommendation : BUY - ICXBTC
Return % - 50+ mid term
Entry: Under 265 Sat
Target 1 - 417 Sat
Crab Pattern completion on Daily.
Low Risk Huge Reward.
Best Wishes.

ICX first reversal signBreaking slowly out of downtrend is ICX first reversal sign, possible bullish reversal soon if the RSI and MACD resistance can break.
Wide spread target between 400 sat ( previous support) and could even wick to 550 sat ( launch price when added to binance ) and this in the very short term, long term i'm more optimistic and staking in august is allmost there.
ICX is now consolidating for the second time in a all time low and i believe it is almost done.
This is not financial advice, just my opinion.
Good luck

ICX Thoughts$ICX
Leaving a lot to be desired. Personally I wouldn't enter here until ICON gives me a reason to; aka breaking above the POC (yellow) on a daily close. I want it to show me strength before I throw myself at it.

$ICX - LONG - 1D - TRADE IDEA- Watching for reclaim of Daily OB
- Volume decreasing during the end of this sell off, hopefully we are just dipping under OB to remove stops and then reclaim
- Want to see FEB lows NOT BROKEN below 537 SATS but could see it act as the support before the reclaim
- Take profits @ 675, 801 and finally between 900 to 980
- Korean Etherum

ICX Rocket about to launch - 25-50% gains in sightICX-BTC has tested the 890 resistance a few times now and is ready to enter the last zone before testing the 1004 strong resistance, crossing which, the trade zone is a fantastic 30% lucrative gains area with top resistance at 1303.
Bullish Reasons:
BTC bulls like ICX too. I see ICX as a keen follower of BTC, very loyal one.
Ichimoku very bullish and favouring ICX long
Candle open above 890 will certainly push price towards 1004 sats and with momentum, the price should enter 1004-1303 trade zone.
Targets
TP1 - 1004
TP2 - 1090
TP3 - 1145 and beyond
Mid-Long term Target 1 - 1300 zone
These are conservative estimates for short term trade.
-----------------------------------------------------------------------------------------------------------------------------------------------------------------------------
If you like this idea, give me a thumbs up. Also have a look at my scripts
AI Lite indicator which populates BUY/SELL signals on chart based on a high probability system
Levels Generator with Fibs script that plots automatic support resistance levels for any timeframe with option to plot manual Fibonacci levels
If you would like to try the scripts, PM me. If you are a new trader/beginner and would like a TA coaching session, PM me for a free 30m session on Team Viewer.
Happy trading.
-----------------------------------------------------------------------------------------------------------------------------------------------------------------------------
Telegram - t.me
Twitter - @TradeChartist

Would you short this? #ICX daily inverted chart.
New all time low reached. Great risk to reward ratio for longing for a LONG term play. Uncertain about short-medium term due to Bitcoin's uncertainty but if you aren't already scaling in here then you should highly consider it at these levels for a long term investment in a fundamentally strong project.


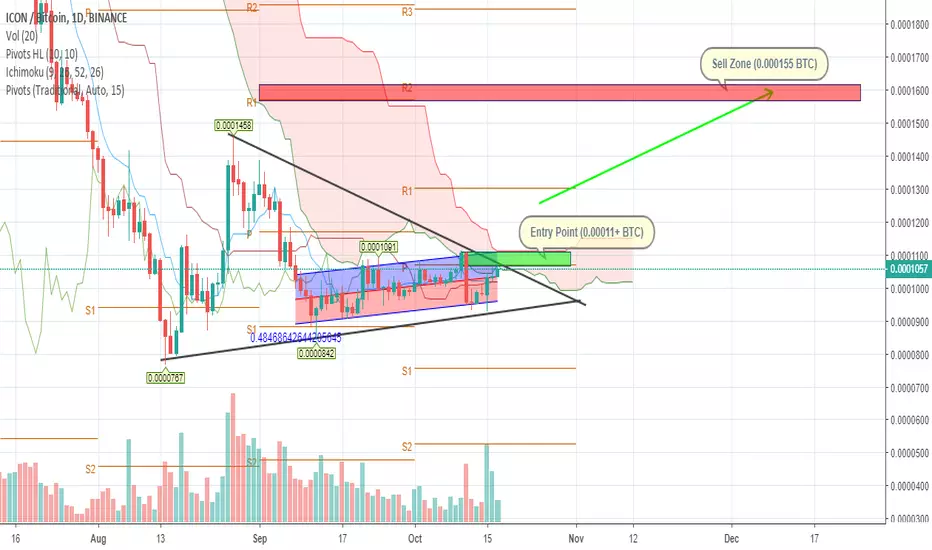
ICXBTC LONGBINANCE:ICXBTC can make a breakout from this Triangle but to be sure wait when it goes above Ichimoku cloud (Entry Point) at 0.00011 and after buy it .
Target 0.000155
ICX READY FOR MOVE UP???If btc doesnt do anything crazy, we should expect move up on ICX, Solid TA+FA


$ICXstop loss set under meme line
I never really rely on FA for any TA but it is strong so going to use it to fit my biases like a pleb
once we can close above the resistance (yellow box) we will see this run nicely
disclaimer: I am currently not in this trade.

ICX 20 % profit minimum A other big deal.
Target : 0.7
0.7544
0.81
0.88
bonus target : 1 $
Check my previous analyse .

ICX/BTC Binance short term longICX will be changing trend after hitting the 2597 resistance (Fibonacci).
