T - Price Targets & Stop Loss📈 What’s up investors! 📉
Welcome back to another one of
💡“Mike’s Ideas”.💡
I post as I find signals… these signals are based on the personal rules I have built and follow in order to make up what I call the “SST Strategy”. Follow for more ideas in the future!!
I have 4 levels marked and colour coded on the Chart.
These levels are:
⚪ White = Entry Point
🔴 Red = Stop Loss
🟢 Green = 1.2:1 Risk Reward Ratio
🟡 Yellow = 1.5:1 Risk Reward Ratio
🔵 Blue = 2:1 Risk Reward Ratio
👀 So what are we looking at today…!!!
🚨( T ) AT&T Inc.🚨
Provides telecommunications, media, and technology services worldwide. Its Communications segment offers wireless voice and data communications services; and sells handsets, wireless data cards, wireless computing devices, and carrying cases and hands-free devices through its own company-owned stores, agents, and third-party retail stores. It also provides data, voice, security, cloud solutions, outsourcing, and managed and professional services, as well as customer premises equipment for multinational corporations, small and mid-sized businesses, governmental, and wholesale customers. In addition, this segment offers broadband fiber and legacy telephony voice communication services to residential customers. It markets its communications services and products under the AT&T, Cricket, AT&T PREPAID, and AT&T Fiber brand names. The company's Latin America segment provides wireless services in Mexico; and video services in Latin America. This segment markets its services and products under the AT&T and Unefon brand names. The company was formerly known as SBC Communications Inc. and changed its name to AT&T Inc. in 2005. AT&T Inc. was incorporated in 1983 and is headquartered in Dallas, Texas.
IDEA


USD/JPY:SELL From Resistance Area - USD ISM Manufacturing SHORTUSD/JPY inside a Strong bearish channel is making Lower-highs and Lower-lows with re-tests on the previous Support areas. Today the US ISM Manufacturing PMI is seen dropping further to 48.5
The US manufacturing sector seems to be a contraction that is set to deepen further at the beginning of 2023, having shrunk for the first time in November after May 2020 when the economy began to recover from the Covid lockdown-induced downturn.
In December, the headline ISM Manufacturing PMI is seen lower at 48.5 while the New Orders Index is expected to improve to 48.1 alongside the Employment Index at 49.1. The US ISM Prices Paid component is likely to continue its downtrend, foreseen at 42.5 in December when compared to the previous reading of 43.0.
Despite expectations of a softer headline figure, an improvement in new orders could provide the much-needed respite to the US Dollar buyers at a time when the European demand for orders is seen dwindling, with the full impact of winter and the Russia-Ukraine war coming through. Even domestic demand and exports are expected to be badly hit due to the stubbornly-high inflation in the US economy.
Our forecast is about a new Bearish impulse today.

Market Bias & Top Stock Watches - 1/1/2023Bias: Bullish
Top Watches: Long - SNAP, BA, CROX, VZ, META. Short - AR
Follow @JLaing for daily review/bias of the market and top stock watches for day trading every morning!
Tune in to my livestream every Monday & Friday from 10 - 10:45 ET to see real live trading and get a more thorough review of my top watches!

bnb potentional move price is moving in a wedge .breakout of which can ralley toward the side of breakout .
market targets are defined inside analysis
trade your levels according to it .
for more market levels and trade idea follow us and share

Unique Idea and View 2024 MultibaggerMy unique Idea Of 3 Time Frame 1m,1w,1d And Conformation With 3 Indicator. Just Follow the Purple Path Line…
Recomondate: First Paper Trade Then Learn. #3tx3i

Increased volumes. Triangle breakdownThe price is in long-term accumulation, there are clear three approaches to the level, the last of which is on elevated volumes, which indicates the strength of the buyer. Potentially, you should expect a local squeeze to the level as confirmation of the trial scenario. I recommend that you go by the fact of breaking through the price of the level with activity in the depth. Goal: 0.9$

Gold Detail Analysis | XAUUSD ForecastHi people Greetings and welcome to our Gold Analysis / Forecast
We Also have out Bearish fore cast
We think we may follow Bearish setup first an than Follow bullish setups
1 Reason for this is it will Also complete H&S pattern on Daily ( mentioned in our bullish setups) Also strengthens The Gold Buyers Along with Fundamentals
Gold is Fundamental supper bullish ,Silver platinum and Oil will Follow

Gold Detail Analysis | XAUUSD ForecastHello People Welcome to Team Decrypters
we have A lot of bullishness for GOLD but main 4 bullish cases are as here

CRYPTO | ETHUSDT -DECRYPTERSHi people welcome to Team Decrypters
A Small risky long Setup on ETHUSDT
Details for signal :-
ENTRY AT MARKET
TP ==1240 /1252
SL ==1205.6
RISKY ONLY 1% ON STOP LOSS

EUR GBP H4 I look forward to returning for a low risk purchase
.............................................................
EUR GBP

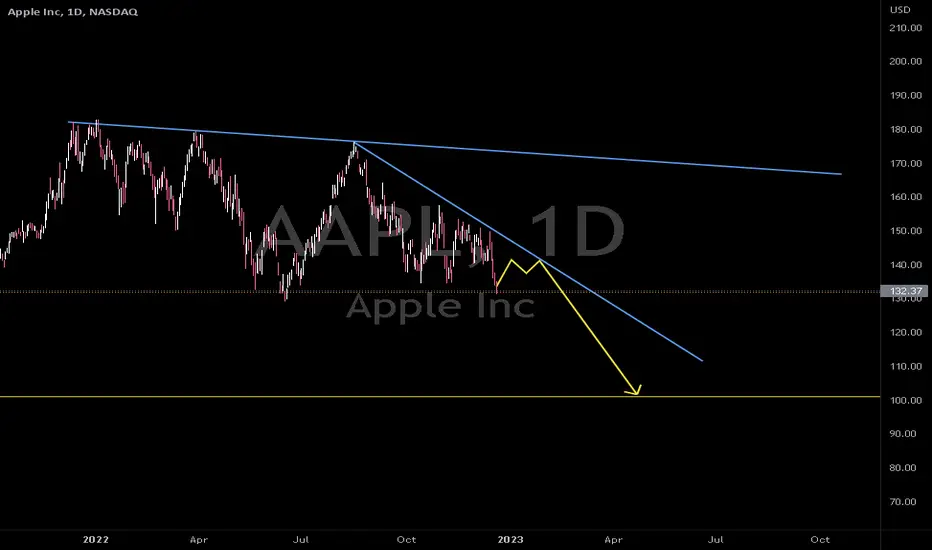
STOCKS| APPLE | AAPL-DECRYPTERSHi people Welcome to Team Decypters
Recently Elon sell 3B$ worth of Tesla stocks so we are considering along with our TA and up coming Recession ,We are targeting 100$ mark on AAPL.
GBPJPY| Detail Analysis | GBPJPYForecastHI people, Welcome to Team decrypters a good long opportunity on GBPJPY
Risk management is key GL !

A breakthrough is already underway. Time to open a sell positionThe price after a strong fall went for correction. For a long time it was traded in the sideways. The market is extremely negative. Volumes are reduced. Once again approached the level of 33.28 $. I expect a breakout and a movement below. The first goal is a local minimum of $ 32.66

$MATIC - High time frame MATIC Looks Heavy at this point,
If we manage to close below the trend line and make a clean break below $0.7 then most likely it's heading towards lower levels around $0.4.
Adding confluence with DXY Holding support and might Rally towards 108 level and BTC Might take out the equal lows in coming weeks, so worth keeping an eye on matic/usdt.
Cheers

PUMA DOWN? (delisted from main index DAX / DEU40 today)The stock was delisted from the main german stock index DAX (DEU40 / GER40), taking effect on Dec 19, 2022.
I will sell the stock if the candle CLOSES below the down trend line on daily basis, using a (european) knock out certificate. It's a kind of short selling in the US.
On Friday 16, the volume got extremely high which let me think of an exhaustion of the bulls.
THIS IS NOT A TRADING ADVISE! DON'T TRADE IT. IT'S JUST AN IDEA WHAT COULD HAPPEN. ALWAYS MAKE YOUR OWN DECISIONS! YOU ARE SOLELY RESPONSABLE FOR YOUR DECISIONS.

The price has formed a triangle. Good entry pointThe asset is traded on volumes. The price has formed a triangle, a situation for the continuation of the movement. Fixed below the volumetric level of POC. The market is negative. I expect a fall, the target is 0.2809$

Good volumes. Expect a drop below The asset is traded on volumes. We came to the level of resistance, got a reaction. Fixed below the volume level of POC, which indicates weakness. We also broke through the sloping support level. I expect the fall to continue. Goal - 0.477$


Nifty analysis This information and valuable because I used strategy this and I want you to analyse and check it out is it right or correct so it's my strategy you can fly to your and its basically my point of view nothing you are not supposed to be copy it or in anything so yeah it is and I want to tell you it's a fourth wave of Lotte it's making and then it's again boom to bullish. No it's been a very straight till I mark 4th

BTC 4 Year Cycle Halving Chart & ConfluencesThis chart simply shows the BTC four year halving cycle past, present and possible future...
Drawing similarities from previous cycles to showcase a likely outcome for the current/future cycle.
"History doesn't always repeat, but it often rhymes" or is this time different?
Finding it useful to overlay the WallStreet Cheat Sheet to each previous and the current cycle. Reviewing personal emotions of each point in the cycle can be apparent and useful. From this we can learn to make better decisions solely based on our emotions.
This chart is a recreation of a chart TradingShot posted in 2019.
After 2 and a half cycles as a market participant, the obvious contrarian play right now is up. Max pain is up. We've seen it before. Predicting price on a time based chart is kind of pointless. The point here is that on the basis of a time, we can feel very comfortable allocating capital based on the time in the cycle and that price is irrelevant. (The previous outcomes 3 years later from this point in the cycle have resulted in significantly higher value)
In the previous cycle I found it very useful to see when to accumulate and invest heaviest. Right now we are at an extreme point where downside is very limited and upside is enormous. RR is on our side.
Try using the color pattern in tandem with the time of year ( including length of time each color has previously played out.) The halving lines are the markers for each cycle. We are halfway through completing the 3rd halving cycle and at the terminal end of the bear market or red box (according to previous history). 1st accumulation is starting/underway. Let's see how this plays out ( or do we already know ;) Exciting times!
BULISH!

My view on ETHHello, i marked long and short areas for ETH (green box and red box), where i will enter trade. The lines between are areas, where can be some price action. Hope it will help, do not trade according to me, I do not guarantee success. :)!
- kiko <3

XLV Short IdeaAfter regarding the 200SMA Daily as Resistance,
forms a Diamond Reversal w/ Triple MACD + RSI Hidden Bearish Divergence
w/ 4 Hour MACD Bearish Divergence
Looking for a breakout and to see how markets open this week before a final decision, loosen or tighten targets as you will.
GIVE ME FEEDBACK
** NOT FINANCIAL ADVICE **
