THE BEST IN ITS SECTOR, AND IT IS "BEST"Supporing Data:
- Midterm, the structure is still uptrend identified by price still making Higher Low
- 3 Days TF, SR flip has been highlighted in the greenbox
- Several Bull Engulf if zoom in in the daily timeframe (in the zoom between 138-140) concurrent with a setup of retracement
The level of 170 is where the sellers are as the price is difficult to breakthrough these area so it might take another buyer powers waiting at the level of 150 before penetrates through 170.
Long this one!
IDX
IDX or IHSG IDEA, FEBRUARY 2021After tapped daily supply at around 6500, it should retrace as this denotes healthy for IDX to have upward movement
This may be how this will play out in my opinion
Retracement to the range of 5717 - 5750 is expected before upward movement. Several data to support the confluences:
- It represents the level of 1H previous supply that has been broken and now act as "S/R flip"
- Green box denotes breaker on 4 HR timeframe
- Concurrent with EMA100 on daily timeframe + EMA200 on 4 HR Timeframe
- Also, on weekly timeframe, we could see EMA20 around that zone
Conclusion : 5717-5750 on first week of february
The next move has been plotted on the chart based on my opinion
Disc on
IDX Composite - Take A Breath & Get Back to Running Track SoonHello traders & investors... how are you?
I hope all of you are healthy & prosperous.
Today, I try to capture the movement of IDX Composite for the next 6 months, 'till August 2021.
IDX Composite will tend to move sideways until June 2021 because the FY'20 earnings result might release "as expected", and Indonesia soon will entering the fasting month (mid of April'21), that may reduce daily transaction and drive IDX Composite slightly lower. Thereafter, start in Q3 2021 it will back to move in up trend in the moment of dividend seasons & Q2 2021 GDP release.
Gong Xi Fa Cai!
-AJ-
ANTM Jericho1.
EMA 55 : Biru
EMA 144 : Hijau
EMA 377 : Kuning
2.
Saat terjadi Cross antara (exponential moving average) EMA yang lebih kecil ke yang besar, contoh: EMA55 menembus EMA144 dan EMA377 maka grafik akan membentuk trend naik menuju batas Soft Resistance dan Strong Resistance yang sudah kita prediksi
Saat terjadi Cross antara (exponential moving average) EMA yang lebih besar ke yang kecil, contoh: EMA377 menembus EMA55 dan EMA144 maka grafik akan membentuk trend turun menuju batas Soft Support dan Strong Support yang sudah kita prediksi
3.
Kapan terjadi Double Death Cross dan Double Golden Cross
- Double Deathcross (saat EMA 55 menembus EMA 144 & 377 secara bersamaan saat grafik turun) terjadi pada sekitar Desember 2011
- Double Goldencross (saat EMA 55 menembus EMA 144 & 377 secara bersamaan saat grafik naik) terjadi pada Januari-Februari
2021 IDX:ANTM
MPMX Current Price at about 15% Div YieldFor MPMX looks good in fundamental as it has lower PBV around 0.34. Current price (575) has potential 15% Div Yield comparing current year DPS at 90 per share.
There is 450 price level if possible the price re-test it, will generate 20% div yield for next year.
EXCL Bearish TrendlineAfter sideways trendline of EXCL as I predicted before (hanging on Fibo 23.6), it broke out the support with Three Black Soldiers and the continuation of bearish signal is happened. Also confirmed with Stochastic RSI.
There isn't any reversal signal, so if it can rebound on Fibo 50, we will see again whether EXCL can break resistance on 2590 or not. Any thoughts?
Summary:
Not a buying signal right now
TP1 2700
TP2 2820
EXCL masih sideways?Trend bearish ditandai dengan Hanging Man lalu dilanjutkan dengan 3 CS bearish. Pada closing hari Jumat, tidak berhasil menunjukkan adanya reversal pattern. Namun EXCL masih ada di support fibo 23.6, jadi apakah masih akan sideways beberapa hari?
NB: analisis murni dari teknikal sederhana, belum dari berita beredar
Bearish sign MTDLLook like MTDL will face bearish phase after ascending triangle pattern fail and now it will test the major trendline. And if its breaked MTDL will fall to next support area as the picture roadmap drawed. Oscillator stochastic was confirmed that MTDL will fall because we found hiden bearish divergence.
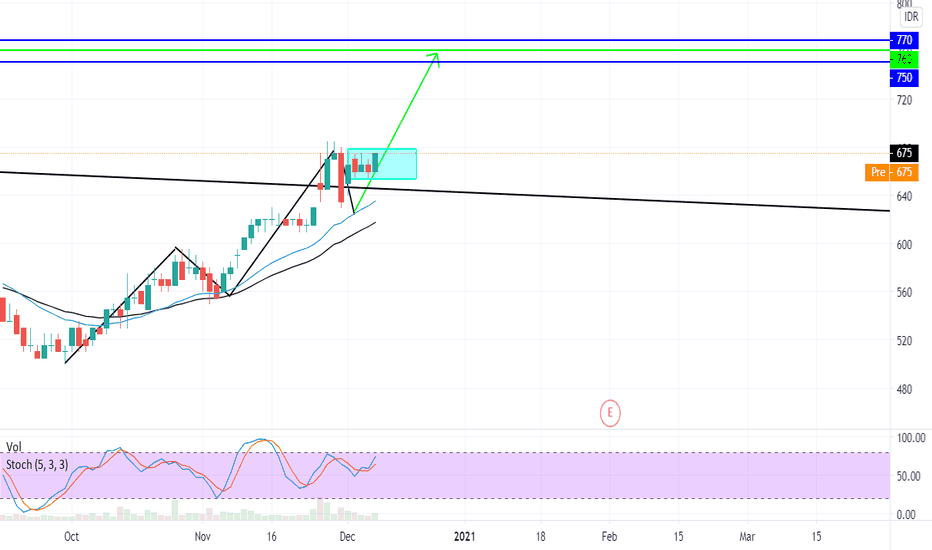
BJTM 13%+ INDONESIA STOCKS EXCHANGEWE KNOW THAT DOW THEORY IS PRIMARY SECONDARY AND PRIMARY AGAIN
THE MARKET ALREADY SECONDARY REACTION AND NOW BJTM IS MAKING A BASE, A BASE IS LIKE A CAGE WHICH THE PRICE TRAP INSIDE THE CAGE, WE HAVE TO WAIT THE CONFIRMATION OF THE BREAKOUT OF THE CAGE, IF BREAKOUT THAN THE PRICE WILL RALLY MAKING HIS PRIMARY REACTION AGAIN,
THE TARGET PRICE AREA WILL BE 750 - 770
AND WHY A GREEN LINE AT 720? WHY THE TARGET PRICCE 750 - 770?
THE REASON IS SIMPLE,
THE GREEN LINE PRICE PROFIT AREA IS BY USING FIBONACCI PRICE PROJECTION (AB = CD) AND IT STOP AT 720, SO IS THE GAP AREA, WE CAN SEE 750 - 770 IS AN OPEN AND CLOSING GAP AREA WHICH CLUSTER TO FIBONACCI AB = CD
STOPLOSS AREA
630
WHY? BECAUSE IF WE BUY AT BREAK OUT AREA, AND THE PRICE ISNT CAPABLE TO RISE, AND DROP TO THE BASE (CAGE) AGAIN AND ALSO BREK THE BOTTOM OF THE BASE WE CAN ASSUME THAT SUPPLY IS MUCH HIGHER THAN THE DEMAND
DISCLAIMER ON!


