GBPUSD 1Dlong term GU. After failing to make an HH and instead break HL then make LL, the retace area has reached level 50 fibo from the last LW swing. it is likely that the market short GU is looking to the last LL swing level.
Ilovetrading

USDCHF TF 1HIn the USDCHF pair, the 1D time frame is changing bullish because it has engulfed the LH. Move to the 1H time frame to find a long position pullback with the upper LH target.

Add #INFOSYS in your Watch listLook at Infosys Daily chart. It looks beautiful on TA. Recently it broke the resistance level, but again its trading under those levels. Also the short term trendline is supporting the stock. Once it breaks the short term trendline, it can rally further downside. Need to closely watch the stock.
0% luck, and 100% SKill are required to become a good trader. You need to need get a proper trading plan.
Few Takeways to become a good trader:
1. Never risk more than 1% of your capital
2. Before entering a trade you should know your Stoploss levels and Exit levels.
3. Dont be Greedy.
4. Trade in stock market like a business and not like gambling.
5. Train your mind to become a trader. Risk only that much which doesnt effects your daily life

EURUSD 1DAny idea?
According to my scribbles who are just learning SND, prices are compressed sell and buy and touch the left RBD. The decision point is on the engulfing candle. It is likely that the price will drop until the start of the compression buy around SR Flip 1.0890


eurusd on long biasso long as price stays between 1.1195 support level and 1.1383 temporaly top,price may consolidate,so long it is ib long bias we can see price breaks at 1.1383 and our target will be 1.1450. the price will shift to short bias if and only if it breaks the 1.1195.

Forecast EURUSD 8/06/2020Trend of 1W touched downtrend trendline. there is a possibility of a bearish market. Look at the TF below to see if LL is broken. TF 1D has not seen a pattern. TF 4H pattern already visible HL-HH-HL. Wait until HL breaks to form LL and LH. Look at the lower tf again to see deeper patterns. In TF 1H it has been seen forming LL and LH. Wait for retrace to take short.

EURUSD - End Of Bullish Run?Price has broken prev. 1D MS High with the current bullish move to a new MS high, suggesting a possible turn around to the downside at least for the short term as bulls can't run forever. I would expect price to push upwards into the LP on the 1H and collect some liquidity before falling possibly all the way down to break current H4 MS Low.

AUDNZD | TF: Daily | BearishPotential triple top followed with a rejection, due to a formation of a head and shoulders pattern. the left shoulder seems to have taken shape, as well as the head (or first peak of the double top).

Forecast EURGBPWill the EURGBP pair form a head and shoulder pattern?
Seeing the formation of the left shoulder and head, just waiting for the formation of the right shoulder

Forecast AUDUSD TF 4HAUDUSD 4H time frame pair position is currently bullish and has touched the bearish time frame 1D trendline area. Seeing the candle pattern that appears is the ascending triangle, then the possibility of AUDUSD will break the trendline and continue bullish then retrace


EURAUD - Short Term BearsQuick and simple one this time, EURAUD looking bearish for the coming week. Price broke MS on the 1H and other multiple levels on the 15M TF so I'm looking for an RTO to the 1H OB or 15M area of interest created as a result of the expansive move downwards before it continues to fall down the the 4H OB at the bottom of the range which is expected to hold as a solid OB however if it becomes a breaker, we can re-evaluate market movement and plans for setups. This move is supported by multiple confluences so we should be expecting the downward move however the market can always decide to change it's mind and continue long so I would be careful of this move.

XAUUSD: BUY- Structure: Uptrend
- Tendency: Upward
- Above support level, breakout down-channel, buy at fibo ext 0.618 level.

Tradig Plan #USDZAR (SHORT)Hey Guys! Like and comment if you like the content. 👍 Subscribe will be a lot of interesting 👌
Sale of the pair after correction SL and TP indicated on the chart
DISCLAIMER:
The opinion of the author may not coincide with yours! Keep this in mind and consider in your trading transactions before making a trading decision.
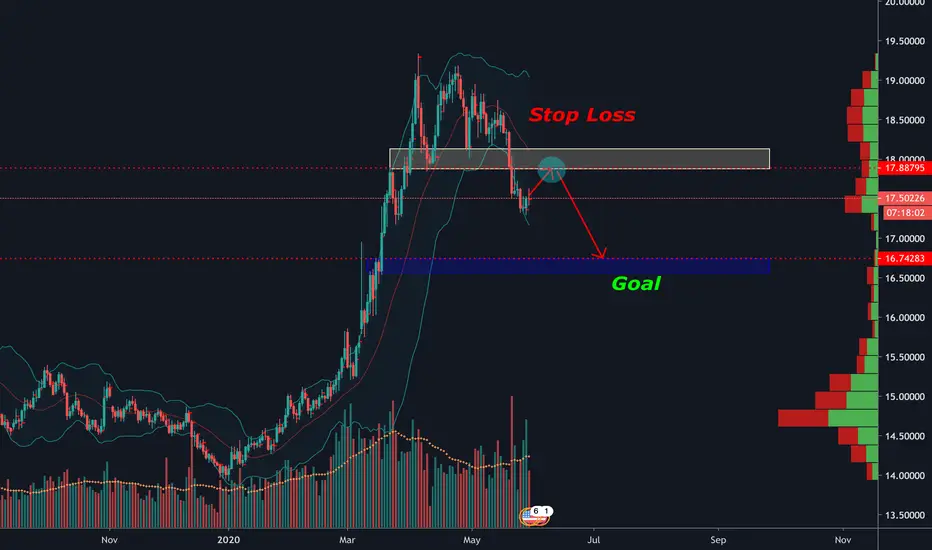
TradingPlan #USDCHF (SHORT)Hey Guys! Like and comment if you like the content. 👍
Selling a pair with current SL and TP levels indicated on the chart

Trading Plan #USDJPY (SHORT)Hey Guys! Like and comment if you like the content. 👍
Selling a pair with current SL and TP levels indicated on the chart


USDCAD - Down to 1.35900? (CONTINUED)Please note that my continued analysis of this pair and others is purely for personal reference and improvement, I just wish to share my analysis and look back on to it as the market develops.
Last weeks Bull run that I had predicted has taken place (marked with blue line) and I believe that this week will be bearish for USDCAD after touching with the 4H supply zone marked on the chart. I believe that in the next few weeks we can expect a tightening of market range as outlined in the descending triangle on the chart, before an expansion to the downside of .35900 and possibly beyond.

SHORT ON NZDUSDPrice broke recent trendline, expecting a retracement to price .59921 then taking a short position to the downside.
