EURUSD 4H TFHi everybody
We have here EURUSD 4 hour timeframe.
We are in a range as you see, price comes to discount, hunt sellside LQ and then we see a displacement.
Also you can see POW3 (ACC, MAN, DIST).
Price comes back to imbalance, touch the OB and is going higher.
I determine 2 point as targets.
Imbalance

Liquidity & ImbalancePrice moves for two reasons:
1. Liquidity
2. Imbalance.
In this set up we have both.
Never over leverage.
Trust your trade set up.
Have fun!
Trading Made Simple

THE BEST AREAS TO ACCUMULATE BTC I am excited to see BTC in this price.
Everyone who have experience in trading know this is the biggest discount he will EVER see.
I marked two major areas that will reverse the price.
Target 1: 19,600-17,700
Target 2: 12,000-10,000
whales will start accumulating BTC from those demand areas (because the Imbalance candles)
If price drop below 17,700 then the next target will be 12K-10K which also the strongest.
BTC is effected by the Dollar and the NASDAQ. This is the only reason for the bear market.
I am not reccomend using leverage for long term positions, like this one.
If you liked the Technical analysis please like and follow.
Keep your trading safe👋

GJ swing analysisTook daily/4H High out. Might just continue lower to fill the next zone at this point but potential short on the premium side of the dealing range.

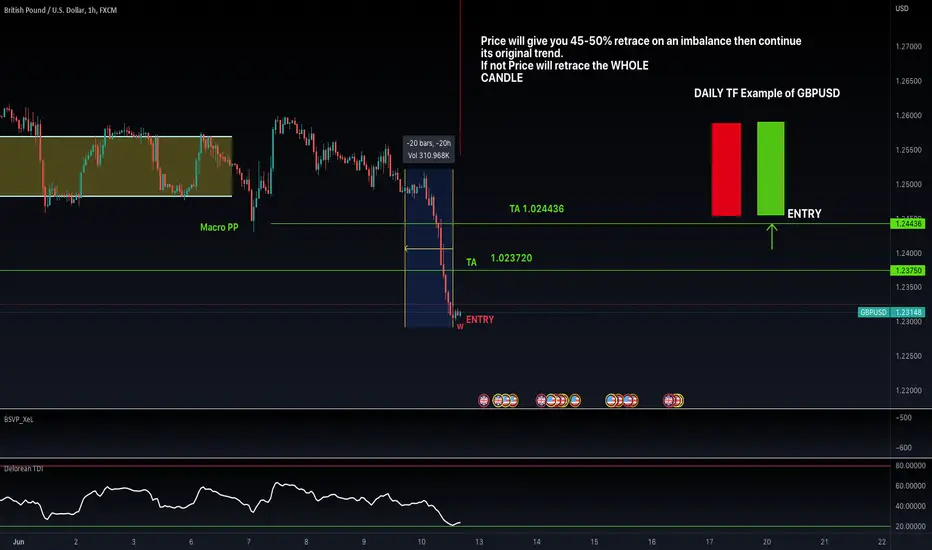
Will GBPUSD RETRACE THAT WHOLE DAILY TF CANDLE IMBALANCE????????Price moves for TWO reasons
1. Liquidity
2. Imbalance
On the daily TF there is over a 200 pip IMBALANCE. (pull it p and see for yourself lol)
A retrace is due.
GBP should LONG to fill 45-50% of that imbalance.
My 1st TA is 45-50% of retrace into Daily Imbalance candle.
After that monitor the DXY closely to identify if she will continue the trend UP or CONSOLIDATE and break to the down side.
Never over leverage.
Trust your trade set up.
Have fun!
#TradingMadeSimple
EURUSD 30 min TFOn daily TF we saw range movement.
In 15min TF, we're in discount and price is going for old highs.
I am waiting for a proper displacement in lower TF(5 to 1 min) to find my setup for long.
there is imbalance and POI and trade zone with fibo that I am waiting.

Reason for the BTC Drop to $29000 and where to from here?In yesterday's video I spoke about why I thought Bitcoin could drop back down to $29000.
1. Volume was decreasing with price going up
2. Big longs were opening up at resistance
In today's video I look at where BTC could go to in the next few days and see on the TPO and imbalance charts why price fell like it did.
I am looking for a small retracement back to the POC and if we have strength in that area I will be going long.
TP - back up at $31000 and if we break out, hold the position to $35000.
Have a look at the video for an in depth analysis.
Not financial advice, DYOR. Papertrade before using real money.
If you liked this idea, please give a thumbs up and follow.
Safe trading.
Shawn

35k BTC in June? The Bullish and Bearish argumentsBYBIT:BTCUSD
Can we see Bitcoin reach $35000 in June?
Or are we going to break down at the current levels?
There are arguments for both sides:
Delta is looking positive and we have reclaimed a previous Lower high. If we reclaim the Lower high at $32300, we could see this as a sign of strength.
Volume is decreasing while price is increasing. This could signal a reversal.
BTC has broken out of the $30500 resistance area and is looking to reclaim the Value Area High for the range, but TPO and Imbalance charts might be showing us what is ahead.
Have a look at the video for an in depth analysis of Bitcoin.
Not financial advice, DYOR. Papertrade before using real money.
If you liked this idea, please give a thumbs up and follow.
Safe trading.
Shawn


SPY SHORT - SUPPLY, LIQUIDITY, PITCHFORKWe are at a supply orderblock which caused a break of structure below. Upon reaching the orderblock, we saw a pinbar + inside bar combination pattern. Not only that, we are reacting to the upper parallel line of the pitchfork. We can target the imbalance and equal lows liquidity below.

EURAUD - Support Trap 🐻This pair is creating support just above the demand and fair value gap.
I have no interest in trading the support or the demand just below it.
My main focus is locating longs within the gap or at the lowest demand.
We will have to wait a while for this to play out but the patience will pay.

US30 POTENTIAL BUY Price has the potential to move higher from the retest of the retest of the 1 minute bullish orderblock.Wait for bullish price action on lower timeframes to confirm the move.

Nasdaq Long opportunityMy thoughts on NASDAQ short term long
Break of structure and trendline, take the long at the imbalance fill and target 4H imbalance

$ZEC - Retracing to Bullish OB Then Attack Liquidity Above *SMT**SMT* = Smart Money Theory = everything you think that is not retail related to trading. First, SMT does not believe that triangles, wedges , trendlines , channels, harmonics, etc. has any effect on how price reacts. I'm Sorry, but you won't convince me that Bitcoin knows it has created a triangle and that it knows how to react from that? It does and will remember price levels, that's it. The second is to recognize that the price is not random, it is set by an algorithm controlled by those that control the asset. The Third thing to remember is price will move toward attacking where there is Liquidity (Equal Highs, Equal Lows, phantom Trendlines etc.) and Balance (Fair Value Gaps, Liquidity Voids.) That's the basics. The rest is very unique in the vocabulary you need to have and the concepts that wrap around these ideas.
TLDR;
Entry: 92.3-92.5
Stop Loss: (88.5-89.2 Depending on Broker and how much your willing to give up below the Bullish Order Block)
Take Profit 1: 96.3-96.4 20-25% of profit removed here (Move SL to 90)
Take Profit 2: 97.4-97.6 (Bulk of the trade off here up to 85%-98% of the trade, move stop into break even)
Take Profit 3: 99.5-99.6 (127% Extension meets the Fair Value Gap Above the equal highs/Liquidity Line
On the Hourly it appears that after price had broker the structure of the lower dealing range, it retraced back down to the breaker of that range and continued up until it hit equal highs with the price before th major drop off. These equal high are creating artificial Liquidity meaning that most traders who see the equal highs automatically think "Resistance" It may be met with some resistance but smart money or Institutional traders know that there are retail traders that have their shorts sitting there with, most likely, a short stop loss.... Or a buy stop with a short stop loss. I see this everytime, The price will come trigger the buy stop people and to take out the SL of the people Shorting with a limit, then it falls more to take the buy stop traders SL out, then continue up to find an imbalance or liquidity. And there's an imbalance at exactly the 127% extension.If there's a slight chance that doesn't happen I do have multiple take profits set up, but more than likely this will be the scenario. I've seen play out so many times that I know there's players in the room with large amounts of money able to manipulate the charts right when they want to. If this doesn't Happen, I'LL be Surprised.
Good luck and happy trading :)

$TRX - 3 Confluences To Short It *Smart Money**SMT* = Smart Money Theory = everything you think that is not retail related to trading. First, SMT does not believe that triangles, wedges , trendlines , channels, harmonics, etc. has any effect on how price reacts. I'm Sorry, but you won't convince me that Bitcoin knows it has created a triangle and that it knows how to react from that? It does and will remember price levels, that's it. The second is to recognize that the price is not random, it is set by an algorithm controlled by those that control the asset. The Third thing to remember is price will move toward attacking where there is Liquidity (Equal Highs, Equal Lows, phantom Trendlines etc.) and Balance (Fair Value Gaps, Liquidity Voids.) That's the basics. The rest is very unique in the vocabulary you need to have and the concepts that wrap around these ideas.
TLDR;
Entry 0.0806 (Already Entered but we have a long way to go so enter soon)
Stop Loss: 0.0847 - 0.085
Take Profit: 0.073541
If you look at the Daily Chart My entry is based upon the Bwearish Order Block (Bottom Last daily green candle before the high). As price seeks liquidity or imbalances, I believe its heading for the imbalance in the 4 hour chart, The fair Value Gap And then if ypou look at the 4 hour theres a Fair Value Gap at 0.073541, Near this same Price is the Discount Price in the Dealing Range (Dealing Rang Example ,
Discount Price is 61.8% of retracement)
Also in this same area is a bullish order block on the 4 hour
So thats the 3 Confluences. 1. Fair Value Gap (4HR) 2. at the Discount Price of the Dealing range (Daily Chart) 3. Which is also at the Bullish Order Block (4HR).
This is where smart Money would be aiming to buy up more TRX at a discount price as it goes past two areas of relatively equal lows on the 15 min chart where most retail traders stay.
They'll believe these to be Support Lines, when it's a false sense of support as Smart Money wil drive the price deeper just to buy Cheaper.
Good Luck and Happy Trading BINANCE:TRXUSDT
BINANCE:TRXUSD
KUCOIN:TRXUSDT
OKCOIN:TRXUSD
COINEX:TRXUSDT

GBPUSD ForecastImbalance and induced high directly below orderblock poi i will be looking for a reaction in this poi before deciding to take it short

PEOPLEUSDT URGENT Update - We're in a critical area!!BYBIT:PEOPLEUSDT
BINANCE:PEOPLEUSDT
KUCOIN:PEOPLEUSDT
People Crypto Coin URGENT UPDATE
PEOPLEUSDT is at a critical Fib Golden Pocket area. Price could bounce here or break down. I give you my analysis and how I'm trading this.
A pennant has developed - the video explains scenarios for trading it and I look at a few areas of confluence.
I look at a TPO chart and explain the reasoning for how I'm trading this today.
The 30m Imbalance chart is possibly telling us what is ahead.
Tight stops if you are entering at this region. Place stops in profit as soon as you can. The lower the risk, the better
Not Financial Advice. DYOR. Papertrade before trading with real money.

nzdchf swing down trend continuationSell limit entry at orderblock. Tight stop loss. Waiting for banks to fill imbalance and mitigate their positions before continuing it's move down and taking out previous lows. 19 pip SL, 230 pip TP, ABOUT 1:12Risk to reward ratio *not financial advice

Limit Order Long CADCHF D1I'm setting up a limit order on the CadChf @ 0.7427. This entry is right above an imbalance and the S1 but beneath a daily support level @0.7475. SL @ 0.7347 and TP @ 0.7690.

GBPJPY: Imbalance to ImbalancePrice trapped the head and shoulders sellers and I assume the majority of them are now all liquidated.
Maybe we can expect a sell to the fair value gap before we begin buying again.
What are your thoughts? 🔥

GBPUSD - Supply or Demand ⁉️Here are my zones and levels for this morning, please update them as you go through the day.
Bears are likely to push price past the Asian low to fill the remaining imbalance (Blue Box) before returning to the supply gap.
In my mind, there is no way that we will see bullish continuations until this blue box is filled so I will avoid trading at this current demand and focus on the zones below.
I am open to trading both the supply and demand but I certainly won't be taking any trades between them.
Be careful trading around round numbers, this is where we tend to see some manipulation because retail is using these levels as areas of support and resistance.
We have no real high impact news events today so we can trade freely.
Have a great day traders 🚀

BTC The Bigger Picture...here is my bigger picture look on BTC, I think we are perfectly capable of coming lower to fill out the FVG/Imbalances on the weekly chart or at least attempt to target them. I think the small pump was a fakeout to get buyers to jump in and then they will go and sweep last weeks low and fill out the imbalances.
FVGs are present on the daily as well for confluence.
The incoming buy volume is very low on the weekly and daily. This isn't giving me much confidence in a reversal.
Keep a mental note with you that we may come to attack the 20k support. There is Imbalance and a bullish OB there, so it is a strong case for a target area.
If we continue to drop lower I will take this Opportunity to start stacking more fundamentally strong projects in particular more XRP, XLM and ALGO for my long term holds. DCA into positions is the most effective and safe way to accumulate and get your ideal entry.
RSI hitting support, though bear markets historically have seen the weekly RSI drop below 30 for multiple weeks. So expect alts could lose another 20-50% in value if that happens.

IMBALANCE ORDER- FILLED!Yesterday EU went Parabolic and didn't give anyone else a chance to get in at those prices.
So this morning price is FILLING IMBALANCES.
This chart illustrates this every day move in real time.
The Market goes up.
The Market goes down.
The Market goes sideways.
3 moves.
Price moves to fill
1. Imbalances
2. Liquidity
Our job is to identify these moves and formulate strategies to help us Capitalize on the Money Moves aka Trends out of Consolidation and Ranging Zones.
Never over leverage.
Trust your trade set up.
Have fun!
