SMC !!! BASED BITCOIN (BTCUSDT) TA SCENARIO I am going to explain the revolutionary SM concept in a later educative post.
------------------------------------------------------------------------------------------------------------------------------------------------------------------------------------------------
If you enjoyed this post and agree with me, a like and a sub would be very nice : )
If you have any other ideas or simply disagree, manifest yourself in the comments ⬇️⬇️⬇️
Stay updated for more content
Have a nice Day : ) Bye!
----------------------------------------------------------------------------------------------------------------------------------------------------------------------------------------------
Imbalance

GJ longscan see an imbalance which has been tested on 1h tf, starting to reject. I can see an up move filling another imbalance and pushing up even higher, tp at an area of liquidity at the moment

EURJPYPrice tend to fall in the big picture, but seems like price not ready yet.
Price is trying to mitigate in some liquidity zone upward in the 4h time frame, and some imbalances needs to be filled before.
this could be a good intraday trade...

Slight Policy Divergence btw RBA and BoCThere is a slight policy divergence between the Reserve Bank of Australia and the Bank of Canada in that the BoC stand more hawkish. Also, there remains a disproportionate polarity in the supply-demand play in oil.
This suggest that the CAD currency will continue to strengthen in the coming weeks and quarters ahead; and, for the trend in the fall of the AUDCAD exchange rate to continue.
*** Please see other posts regarding the BoC.

Short on XAUUSD ? Price to come and fill imbalance at around 30% on fib tool to come and grab liquidity test of the imbalance

Smart Money LONG | EURUSDI have now been tagged into my 2nd position of the day on EURUSD
Lets see how this one plays out

Bitcoin OlympicsLook at the similarities between both wyckoff accumulations.
The only thing that scares me is that all of crypto twitter expects this. crypto twitter might not be the best indicator, but media is a part of how the fear & greed index is messured so i think it's worth mentioning.
What i mean is that, if everyone expects it to drop towards $40,5k one last time, there will be so much liquidity below that level. This might cause large institutions or the composite man to send bitcoin below 40k towards lower imbalances or orderblocks...

Smart Money LONG | GBPUSD2nd Long position of the day on GU
Let's see if we get a reaction from this zone.

Smart Money LONG | EURUSDJust been tagged into this position on EURUSD
Let's see if this can turn into a good trade.
Any questions feel free to ask

USDJPYLast buy before falling.
In my point of view, there's no reason to not buying this correction, even if it seems bearish on the big picture.

EURUSD daily Last weeks PA we finally saw price break out of the range we have been stuck in since November.
This left a nice order block to look for opportunities in next week.
I would like to see price test the 1.6000 area in the coming weeks as for me this is a key order block and key daily structural point.
Keep it simple and trade what you see.

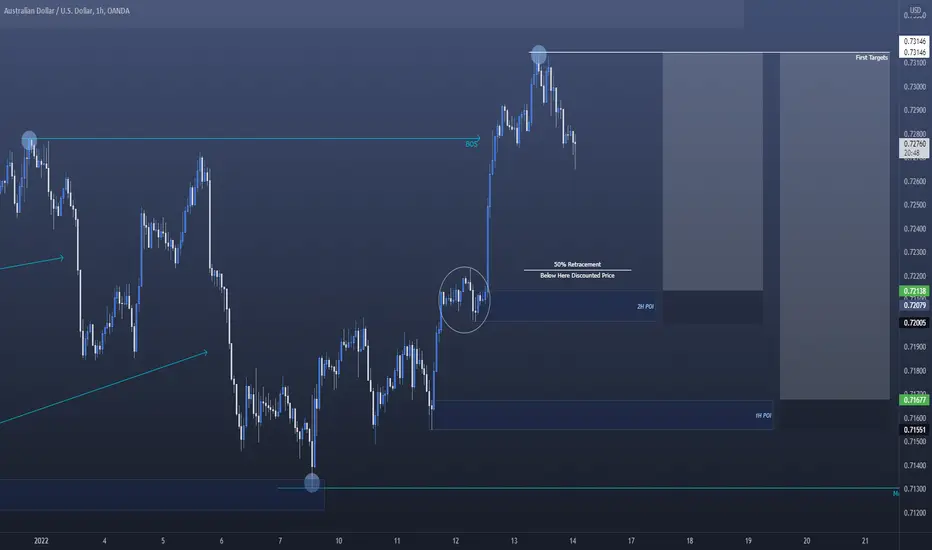
Smart Money LONG | AUDUSDLooking at AUDUSD
Anywhere below the white line is something of value at a discounted price for a long.
Two potential entry points, both I will set pending orders on. Lets see if we get an entry of any type.
Potential shorts incoming on GBPUSDWe have broken the channel and now hit a key supply zone, i will be watching closely to see if this is a liquidity trap from above the channel to move back in.
We are now nearing a key zone on the 4H TF with an imbalance zone. I will be watching the orange zone within that blue zone for signs of rejection.

GBPUSDFrom a smaller time frame, this could be our intraday targets once #GBPUSD start to fall.
Take a look to the previous setup from a Large time frame view attached down.

XAU/USD - Manipulation candlesWe recently had a break of structure on gold, creating a pool of liquidity on the downside. Gold recently tested off an order block and started moving to the downside on the 1h time frame. But on the smaller timeframes just above that previously, evidence that manipulation candles have come into play can be seen much clearer. The candle that look out liquidity on the smaller times may get mitigated before price starts to move lower. There are two potential entry points I've marked out, an IC on the 15 min timeframe, and an IC on the 5 min. The first take profit target is a 1:12 risk to reward which is more likely to play out, even if it's a temporary move. The other two are a bit more ambitious, but if this is truly a break of structure then hopefully we can see price make it's way the eventually.
Also looking at both sides of the coin, there is still a lot of imbalance in price above the entry area, and on the daily timeframe price looks very bullish. So there is also potential that price could go past entry and stop loss area to rebalance price first before making its way down eventually, hence the low risk, high reward setup.

NatgasDaily demand is created by the banks, now we are heading to the supply are that is created by the banks and the instutions.

Bitcoin CorrectionNow that we've dropped even lower, we're nearing in on an important point of interest (blue box).
If we don't see some kind of reversal in this box, and we drop below it, i think the black & green box are next point of interest.
This is an imbalance that could still need filling up, and an orderblock which could be mitigated.
I know things look kinda bearish in the shortterm, but if in doubt, zoom out: we're still in an uptrend on the bigger timeframe :)

GBP Expecting Lower PricesThis is the Daily Timeframe.
KEEP IN MIND: This analysis is solely based upon Institutional Structure, nothing else.
When an impulse takes out a previous low, it creates a Break of Market Structure (BMS), showing signs of weakness. When a previous low has been violated, the swing high that was formed prior to the violation of the low turns into a Protected High (PH). This means that we expect the market to sustain bearishly and stay BELOW the Protected High.
GBP has kept breaking lows and creating new PH's whom none of them have yet been violated to the upside.
I expect GBP to keep moving lower. I am only bearish until we break a newly created PH to the UPSIDE , as this means that we might move higher. But as long as GBP keeps doing these moves we can expect GBP to weaken in the long run.
The Weekly timeframe is doing the exact same thing, and I expect GBP's price to go lower for the next months UNTIL we break a PH to the upside, showing signs of strength.

USDCHF - POTENTIAL TO THE UPSIDE AFTER A LIQUIDITY GRABLooking at a first push up on USDCHF yesterday.
Price has now entered an accumulation phase and my preference is for price to breakout to the downside to collect more orders and clear imbalance before another move up.

NZDUSD - POTENTIAL STOPRUN & LIQUIDITY GRAB BEFORE ANOTHER PUSH Looking at a first push down on the NZDUSD yesterday.
Price has now entered an accumulation phase and my preference is for price to breakout to the upside to collect more orders and clear imbalance before another move down.

EURUSD POTENTIAL LIQUIDITY GRAB BEFORE A MOVE DOWNLooking at a first push down on the euro yesterday.
Price has now entered an accumulation phase and my preference is for price to breakout to the upside to collect more orders and clear imbalance before another move down.

Smart Money LONG | GBPJPYLooking at GBPJPY
We have a very similar set up to EURJPY
But with this pair I am more mindful that we are at a Daily OB that could present an area for price to turn around.
Will monitor this one very closely at the London Open.
Any questions feel free to ask

Smart Money LONG | EURJPYLooking at EURJPY
I have a nice 5min POI that I am looking to enter a long trade from here.
Let's see if the price can return back to where price impulsed to the upside to create a new structure high.
If you have any questions then feel free to ask
Ben
