Smart Money SHORT | NZDJPYLooking at NZDJPY we are currently in a daily POI and 4HR POI, on the 15min we have signs of bearish momentum kicking in with a break of structure.
Waiting now for price to pull back into the last area of demand on the 5min TF and see how price reacts
Any questions feel free to ask
Imbalance

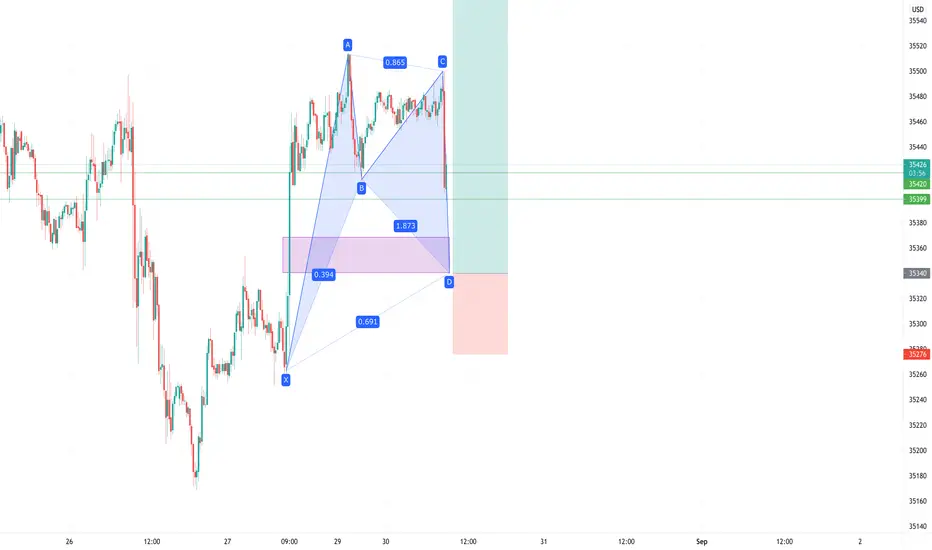
Potential Shark Theory The Shark pattern here would make overall sense for me for price action to follow as price action would induce liquidity while imbalances are covered

Potential Shark + BOS We have a potential shark forming, price just broke structure and has an imbalance to fill from a previous IFC along with liquidity trapped at the X point.
The shark completes at .86 or 1.13 (.86 doesn't cover the in-balance) There will probably be a liquidity hunt if price reaches the X point and if so the 1.13 will be our target
However, we have potential volatile news dropping for the EUR in 1h 20, which could send the EUR either way so I'm going to wait until then before dropping the signal.

Smart Money LONG | GBPAUDLooking at GBPAUD
We have currently broke multiple levels of structure after a descending channel
Now waiting to see if the last level of supply is mitigated in order to send price higher.
Any questions feel free to ask

Limit OrderBullish price action along with potential Bat completion and Imbalance fill from the last IFC
Smart Money LONG | AUDCAD Looking at the structure we have formed at a Daily POI
With the descending kind of nature towards that level, we now have a break of major structure suggesting that price could be about to turn around and move to the upside.
Waiting for some sort of lower timeframe structure to form in order to get in on this position, so we shall have to wait and see how it plays out.
Any questions please feel free to ask in the comments or via a message
Thank you
Take Care
Ben

A fresh week and fresh PAGood morning traders!
Hope your weekend was good and your weekend reviews gave you insight into your trading last week.
Looking at todays PA I still think we need to wait for further development.
The large bullish move Friday left lots of imbalance behind and many unprotected orders.
On the Daily TF we have now broken the downtrend and have moved to a daily buy range, this signifies a return to bullish momentum in the market.
I will be waiting for further development before entering any trades.
As always Trade safe
EnvisionEJ.

FILLED IMBALANCE & BREAK OF STRUCTURE ( EXAMPLE)This is an example of institutional concepts BOTH IMBALANCE/FAIR GAP VALUE AND BOS (break of structure)

NZDUSD SUPPLY ZONE (OB) 10 minPrice is looking to clear the liquidity above and to trigger the supply zone and come back down to clear the rest of the liquidity lying below (arrow with $s) just above imbalance that needs to be filled. If it doesn't hold then it is because the price wants to mitigate a past order block show at the level with the yellow line. The pink shaded area is a higher time frame supply zone (D).

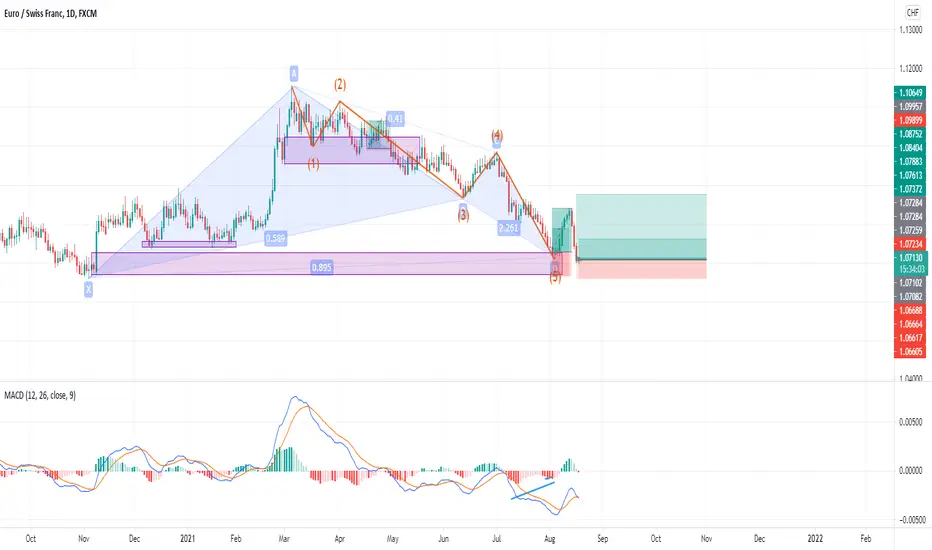
eurchf longeurchf long
One more leg is ecpected in shorter timeframe
harmonic pattern
Elliot Wave
supplyanddemand
smartmoney
order bloc
wychoff
AUD/JPY perfect buyRight now the price is holding above that 79.500 daily support line. Looking for a retracement back to 79.500. From there will go up to hit the first daily resistance and break it to hit TP (second resistance).

EUR/USD at a very interesting place right now - Could it reject?With a previous Lower Low being made and the correction about to complete will the Euro drop from this Daily Supply Zone - I'm sure there will be a reaction - mark it out and lets see.

Gold - Another Drop Incoming?Currently, we have had a strong impulse followed by a slow retracement. The Impulse took out a major Low, showing Sign of Weakness (SoW) as the level couldn't hold.
We also have an M - which is a bearish pattern where we can expect a bearish reaction at the mitigation block (MB).
Additionally, the market is in an Optimal Trade Entry (OTE), where we can expect lower prices.
Gold also just filled in the Fair value gap (FVG) that needed to be filled, and from here we can look at bearish pressure.
We also have imbalance to the downside that also wants to get filled.
Target? We have 3 perfectly equal lows, which is a goldmine for banks as retail traders have their orders here. And since it's GOLD, we all know gold loves to manipulate retail traders, so therefore I'm looking for a Sweep (Stop loss raid) below the line to take out retailers Stop losses, causing a so-called trapped market.
Confirmation Summary: M formation, Impulse & Correction, SoW, We are inside OTE, FVG just filled, Imbalance, 3 Perfectly Equal Lows (SSL).
Should the setup fail and gold starts moving higher, I'm looking at the level above the M formation where it says BSL @1833.43, and the nice equal highs @1903.77 higher up.
The last Setup I posted on gold here on tradingview was a great success, as from where I posted the analysis it went straight to the pip of my target, with a downfall of 2300 pips. Now, I'm currently already in a sell position from 1791.525, and the trade is running nicely in 5R profit with stops at breakeven. Continuing to hold...
This is just my perspective and idea, do your own research :)

USDJPY Harmonic pattern
BEARISH REVERSALS
Direction
Bearish.
Trigger
USDJPY SELL SETUP
- UJ is retesting structure support
- Price is building in a harmonic structure
- Price filled imb
- Structure predilection is pushing down
- We can expect the market to drop in order to complete the last leg of crab & gatley
- Sentiment - negative
- Momentum (bearish)
- Plan is to go Short on UJ
- Take the trade when your rules are fulfilled
A BEARISH MOVE is probable in this market.

GBP USD to continue bearish after corrective move?There is a good chance a move down could happen on this pair but will have to see how price reacts at the area of supply I have and also if using the daily chart as a main chart... will it move up to to the 50% of the previous drop?
Always react and never predict - if areas you have are violated then re draw and go again.


GBPCHF - Retracement then LongWe are currently inside a Discount Area, above a weekly bullish Orderblock and a daily Mitigation Block. A retracement should happen and it should test the mitigation block or Deeper into the Weekly bullish Orderblock. Targeting the Bearish Breaker (Our first PD Array), or the Weekly Orderblock area into Equilibrium. We also have a Liquidity Void (imbalance) to be targeted as extra confirmation.
This is just my perspective on the pair. Do your own research and good luck!

Back Testing GBPUSD One Loss Two wins Im continuing the OANDA:GBPUSD back test loss the first trade but quickly adjusted to win two back to back patience is the key understanding the higher time frames as well.

GBP/USD - Chart Mark Up -16th August 21Daily chart still showing a bullish market from what I'm looking at.
I would rather price dropped in to the lower 50% based off the Bullish Structure break and previous broken supply zone and give a rejection with the upper untouched Supply zone as a potential area for price to climb.
But I cannot predict and never will, I always react to what the chart is showing me and then trade based off that.
These are areas to keep note of when you're down in the Lower Timeframes taking trades.

audnzd longaudnzd long
taking 2 more traders with little loss
2 trades are aleady active
All trders are active. Now they is 4 active traders.
Elliot Wave
Harmonic Patterm
supply and demand
Order Block
Order Block + Imbalance

EURUSD Possible Long-Term Downside ObjectivesSeen on the Monthly Timeframe, we see that we have created an M pattern in the past, where we retested a strong Bearish Orderblock before melting to the downside. Now we have created this SAME M Pattern, and currently testing a big Bearish Orderblock once again. The market tends to repeat itself. We also have lots of imbalances to fill, as well as possible mitigation of the Bullish Orderblock where we could potentially have a rejection up again, and Sell-side liquidity all the way down as a double bottom which the market loves to come to, take out all the liquidity and then possible reverse.
We may have a long-term bearish bias for the EU.
+ The USD will go to sh*t ...
Targets:
- imbalances
- Sell-Side Liquidity
- Order block

What to expect when market open | GOLD Trade idea
Gold slipped on Friday as a stronger dollar dulled its appeal and pushed the metal further from one-month highs hit in the previous session.
so what to expect? Market flow is bearish, however, possible bullish movements are expected during the following sessions.

(NZD/USD) Potential Long Term Move Down V2An alternative situation - we have a very well-respected Trendline that has a high chance of getting manipulated. The green area marked above also has a lot of orders laying above so we could see those highs get taken out as well as mitigate a bit more of that Orderblock
¨
(From my previous post)
This is a Daily Timeframe perspective.
The Market has just tested a strong Bearish Ordeblockwhich is supposed to hold the market down. We also made a deceleration, going from a bullish market which is now a bearish market.
The black lines that are drawn on the chart, is Sell Side Liquidity which are attractive targets where the majority of Orders lay in the market,
The yellow areas are imbalances, where the market has moved too fast, creating inefficiency, so the market should fill a lot of these yellow areas. Another attractive area which the market wants to mitigate.
The blue area marked up all the way down is a bullish Orderblock, which could be a potential reaction point.
I don't know how far the market will drop, but I do expect a lot of these areas to get filled.
