BTC correction before bullish continuation?DISCLAIMER: Im not an Elliot Waves guru but only use the waves as a reference of a trend.
BTC seems to have finished a three waves correction after which is seems to have started a new trend. What we know about trends is that it moves in waves as well, impulse correction, impulse correction, impulse correction...
On a lower timeframe we can see a perfect pullback to the Fib 0.618 level.
After which it surpassed the previous top creating a higher low followed by a higher high. Up next? Higher Low (if it is a valid trend). Taking the Fib from the low to the high of the latest impulse we get to the 50K area.
This corrective leg down should consist of three sub waves, which would look something like this:
As said if the trend is valid, the price should never go below the previous low so that is where you should place the stop for this idea.
The final impulsive wave of this set might not go directly to 74K but that would be my ultimate upper target.
—————
Do Your Own Research (of course)
Trade at own risk (of course)
Only trade what you can afford to lose (of course)
Impulsewave

GOLD Trading Idea - 09/Mar/2021Hello Traders,
Hope you all are doing good!!
We can see the momentum shift for GOLD.
I expect more upside after the correction as shown in the chart.
Please follow me and like if you agree or this idea helps you out in your trading plan.
Disclaimer: This is just an idea. Please do your own analysis before opening a position.

USDJPY 1:3 LongBounced off the support so I'm expecting some bullish momentum.
Prices also bounced off the range of the 61.8% Fibonacci level.
Looking to catch and ride the impulse waves into the swing high area.
Stop Loss set below the dynamic support.

EURUSD Short 4H impulseThe 1H structure has finally shifted structure from Bullish to Bearish by creating a Lower Low. I entered short when the Higher Low was broken. Will be looking to scaling in if price and structure gives chance.
Note:
This is only for educational purposes only and not signal.

Is BTC in wave 3 of Elliott Wave?Potential projection:
Bitcoin could possibly be reaching the top of wave 3 of an Elliott Impulse Wave. Be on the lookout for Wave 4 to drop back down but probably not lower than 4300-4200. If support shows, be ready to ride wave 5 back up!! Maybe upwards to 60k! 50-60 Day projection.
Thanks for your time!

Wave 3 of Impulse Wave H1 GBPUSDLooks like on the H1 chart of GBPUSD we are in the middle of the 3rd leg of an impulse wave.
Remaining Wave Targets:
Wave 3: 1.3963
Wave 4: pull back to the 1.3853 or 1.3787 area
Wave 5: should give us roughly the length of Wave 1 putting us around 1.4026


GOLD to the Moon 🚀🚀🚀Good Day Traders !!! We just rejected for the third time this strong level of support around 1855-1853. We expect gold to start his impulse to the upside since we can clearly see that on the Daily we clearly tested almost all the level of the fib retracement during the correction and we expect to see a continuation to the upside. Also from an institutional perspective I can see on the last report from the non commercial institutions a massive number of long position added as well as a big amount of short positions being closed which can mean a strong gold during this week.
Now if you enjoyed this analysis smash that like button and share !! If you have a different opinion I would love to hear about it in the comment area.
Trade safe !!

EURCAD-4H-Short potentailHi folks;
ON EURCAD 4H timeframe we can see a divergence on MACD and the other hand RSI has a breakdown which is marked.So, we can see an impulse and Correction on the chart.we can expect the candles moves down till demand zone.After Breakdown and retest we can get short till 1.52787 or 1.50846 level as a target.
JUST KEEP WATCHING FOR BREAKDOWN AND RETEST.
I look forward to receive your idea or comment.Put it right away guys.

GBP/CAD UPDATE. Are we ready for the next launch ? Good Day Traders !! On this pair we have a very strong impulse to the upside made during the past week as we expected, now the market started a nice correction to the 0.382 Fib level. for such a strong impulse we expect the market to retrace at least to the 0.5 Fib level which aligns perfectly with a strong support area and demand. We will be monitoring price action on the 4H timeframe when the market reaches this area in order to place a nice long setup with a 1/5 RR so we can ride the continuation of the impulse to the upside.
Now if you enjoyed this analysis make sure to like and share. I will be linking the previous analysis of this pair in the comment area below.
If you have a different opinion make sure to leave a comment in the area below for further insights about this pair.
Trade safe !!!

GBPAUD short setupGBPAUD has broke out of this asending channel with a massive bearish impulse, we are now waiting for a correction and market to test the broken support as new resistance, if we see a nice slow correction and all other rules are met we will be dropping down to our entry timeframe to look for a valid entry.

UsdJpy - Bullish PatternsUsdJpy, after the bearish shark pattern comes the bullish 5-0 harmonic pattern.
We are buying at market price due to the Bullish impusive wave from the lows in 5 waves
Target will be 105.5, whilst above invalidation level 102.50

Gold counting the new impulse!!Hi, everyone,
The gold market is in bullish sentiment. if we consider it as a start of a new impulse move of price action.
We are still at 3rd wave of the Elliott wave theory. So hopefully we may see the gold price to change positions to new heights within the next few weeks. Thank you and trade safely.

eth usdt 15 min candles elliot wave impulse wavelooks to me like eth is gonna keep going based on this elliot wave fractal possibly repeating

VeCHAIN and a great BUY-CHANCE!Hey r tadomaniacs,
Vechain seems to continue its UPTREND and has recently created the next Impulse-Wave.
This could cause nice bullish confluence and so a break of the resistance-zone in order to create the third and extended Wave.
Looking at the Wave-Sctucture, we can expect at least two more Major-Waves upwards in order to complete the entire Impulse.
With this trade we could just participate the next impulse before we head into the next correction.
I will patiently wait for a breakout before I buy!
LEAVE A LIKE AND A COMMENT - I appreciate every support! =)
Peace and good trades
Irasor
Wanna see more? Don`t forget to follow me.


QGMD - Elliot Wave TheoryAnother setup of impulsive wave by QGMD.
Had completed wave 1 and 2. Price likely move in impulsive wave-3
Good entry during pullbacks or corrective wave during uptrends - at wave 4.
Riding the trends at wave-3 and TP at wave-5

Prepare for Genedrive to burstAnyone in still doubt? Just look at the RSI trend-line retest. The uptrend move has been started and will break up next week.The current move we are in is a new impulse and will be full steam ahead, you have been warned. Get GDR on your watchlist and buy while its this fart low.

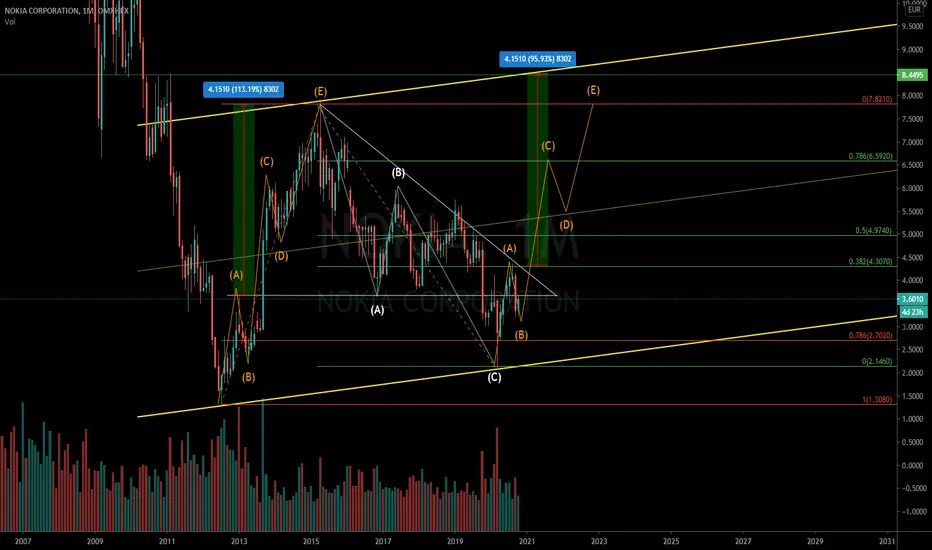
Nokia possible impulse wave in the making!Nokia hasnt been looking to good the past couple of years, but this all could change very fast.
with the upcomming Q3 earnings release coming up this thursday and alot new 5G contracts in their pocket this could be the start of a big impulse wave up.
fundamentals:
# march 2015 can be seen as the beginning of a HUGE descending triangle with a fake bearish break out starting at september 2019. Nokia is currently being traded at that so important level and needs to be taken in order for this lookout to become truth. after that the level to watch is 4.3 as this would confirm the bullish breakout of the triangle. NOTE: descending triangles are normally bullish patterns, but trade carefully as their are some huge levels to conquer.
# Nokia has been a big factor in the 5G industry with over 125 contracts concerning 5G, with the expectations of 5G becoming bigger and bigger this would logically push nokia's shares higher and higher.
# the chart shows that the fibbonaci level 0.786 drawn from our last H/L was accepted as a support level (currently being traded in the golden pocket area which i didnt draw to clear the chart a bit )
If we manage to break the golden pocket area upwards these are the level to watch and possibly take profit:
TP 1: 4.30
TP 2: 4.97
TP 3: 6.59
TP 4: 7.82
TP 5: 8.45
Stop-Loss : between 3.2 - 2.7
Dont over leverage!
Trade safely and do your Risk Management !
Give a follow and a like if u liked my analyse on nokia!
Dow Jones Elliott WaveIf the economy needs stimulus this bad, then the health of it isn't good.
Earlier today, President Trump said he wanted efforts placed on the Supreme Court justice in lieu of hammering out a stimulus plan. Stock fell hard.
Two weeks ago, I shared an Elliott wave chart that suggested a hard fall in $DJI could be coming soon.
My wave labels are slightly different from that day, but the spirit of the message is the same. US stocks could be on the forefront of a hard fall in a wave 3 lower.
I anticipate $DJI falling to $22,000-24,000. From there, the models diverge. The primary count suggests deeper cuts below the March 2020 low. An alternate count suggests a bounce in the $22-24k range en route to new highs.

Dollar Index (DXY) is not out of the wood yet (Elliott Wave)DXY has room to run higher. The Elliott wave pattern suggests we are in a third of a third higher . If so, then DXY should continue a trend towards strength.
There is an orange trendline formed over calendar year 2020 in the way. Breaking above the orange trend line is a sign of strength.
Failure at the orange trend line or failure below 93.33 will bring into question this third of third wave (in Elliott wave speak...third of a third is typically the longest and strongest wave).
If DXY fails at the orange trend line, then we may have to consider this an A-B-C corrective bounce opening the door to new lows. (Alternate count)

SEE roadmap - buying this breakoutI expect a substantial move on Seeing Machines this week and in the next months ahead. With the recent RNS the company just entered into a new market of OMS which they are already dominating. SEE is way over conservative in their market share projections. 23% in their OMS figures and 30% in DMS. House broker`s old target is 7.2 on the DMS auto market only with the 30% auto market share. Add OMS 1,5 billion market (23% of it targets to 7.2p itself), add cash generating fleet not included, add Aviation industry potential, add the value of the IP in chips and mobile tech and the wide variety of market application. Conservative target should be anywhere between 30p-£1. A real gem to buy at this price and hold for a short-mid-long term.
My ltf roadmap is also very conservative. There is no doubt the move up to 4.9 was impulsive, and that we have finished correcting here in value and time. The move up is a wave 3 as well, and my target to reach 7-10p in the next weeks ahead is only a x1.6 extension of wave 1. This can over extend easily. Also wave 5 is double topping at 10p, very conservative assuming it will just truncate. The whole structure is a bigger ABC also a conservative approach not assuming it is impulsive overall yet, A wave will finish anywhere above 10p. Then we will see how it develops and whether a new roadmap is needed to target £1.
Don`t need much convincing that these prices are way too cheap for the development ahead of Seeing Machines.

Silver Sets To Complete A Five-wave Impulse PatternKindly support this analysis with your likes and comments!
The Silver 4 hourly chart reveals an incomplete Elliot Wave impulse sequence from wave (b) high on the chart. It's labeled i-ii-iii-iv-v. Wave iii is the longest wave and its sub-wave of wave iii is also visible.
According to EW theory, once the corrective phase in wave iv is completed an impulse move will follow it in wave v . In Silver's case, the correction unfolded as a double zigzag and also terminated around 50% Fib level. Yesterday daily price action also close as a bearish engulfing bar.
With all the confluence, we can expect Silver to head lower in the short-term. The setup will be considered invalid if the red line on the chart is breached.
What's your view on Silver? Let me know in the comment!
Good luck on the chart,
Veejahbee.
