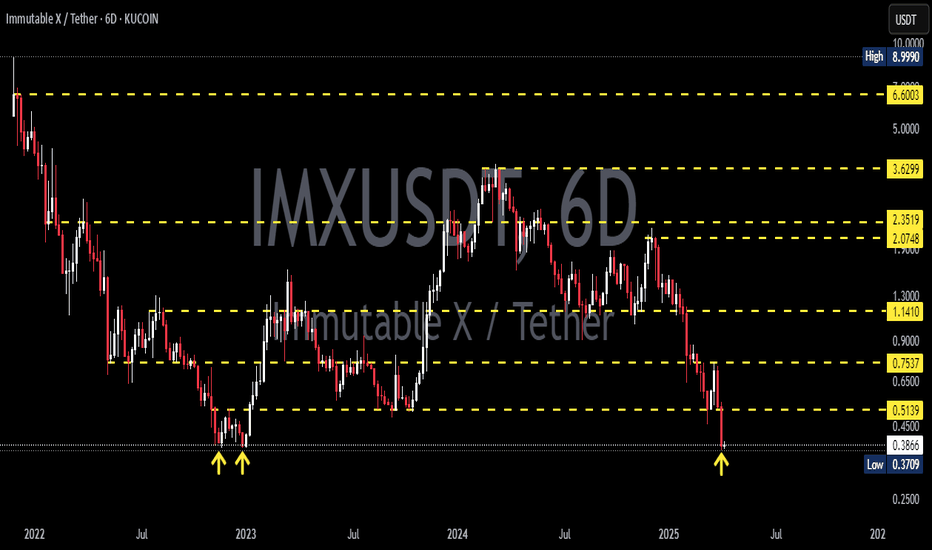
Imxusdtanalysis
IMX middle term targets Watch this BINANCE:IMXUSDT middle term targets
Spot.
Possible Targets and explanation idea
➡️Weekly global fib levels. Zone (green box) marked in 2022 all zones you knew from last posts 2 years ago. Still relevant and will be relevant
➡️You can track with MP indicator how whales accumulate and distribute position
➡️From 0.38 IMX pumped to 3.70 and we got a 2 main signals to fix profit + RSI bearish div
➡️Now step by step they start accumulate position again. Green box relevant
➡️Tested on W tf fundamental value of token based on Take profit indicator
➡️Middle term target marked by green circle. Potential will be way higher
Hope you enjoyed the content I created, You can support with your likes and comments this idea so more people can watch!
✅Disclaimer: Please be aware of the risks involved in trading. This idea was made for educational purposes only not for financial Investment Purposes.
---
• Look at my ideas about interesting altcoins in the related section down below ↓
• For more ideas please hit "Like" and "Follow"!
Is a Head and Shoulders pattern forming on IMX?Hello everyone!
#IMX, I dare to suggest that a head and shoulders technical analysis pattern is forming on the chart.
It can be observed that the price reacts well as it approaches the 0.786 Fibonacci level. In this area, the left shoulder was formed and now the right shoulder may be forming.
The neckline is at a strong Fibonacci level of 0.618. The price potential upon completion of the pattern is around $0.85. However, the decline may be halted by Fibonacci levels of 0.5 - 0.382.
IMX/USDT Indicating continue the upward movement if breakout!💎 IMX has recently exhibited noteworthy market dynamics, bouncing from the support of a bullish pennant pattern, signaling a potential upward movement toward testing the resistance of the same pattern.
💎 A successful breakout above the pattern's resistance could pave the way for further upward momentum, possibly reaching our target area.
💎 However, if IMX breaks below the support trendline of the pattern and subsequently breaches the demand area, it will indicate a reversal to a bearish trend. In such a scenario, the price may embark on a downward trajectory, targeting the support area around $2.59.
💎 IMX must bounce decisively from the support area to sustain its upward momentum. Failure to do so, coupled with a breakdown below the support area, would confirm a return to a bearish trend, leading to continued downward movement, possibly towards stronger demand zones.
IMX - ImmutableXI've made the decision to buy some IMX (SPOT) with a target of 0.95, 1.25, 2.1. I've split the order into three parts: the first at the 0.6, the second at 0.5 and third at 0.4.
The information provided here is for informational purposes only and should not be considered as financial or investment advice.
IMXUSDT heading towards daily support, long favorable from thereThe price seems to be heading towards the daily support DS1. This daily support zone is sitting around 0.601-0.609. A long will be favorable from that zone as the probability of the price to bounce from that support is high. The target of the long trade shall be first 0.623 and then 0.634 as marked on the chart.


