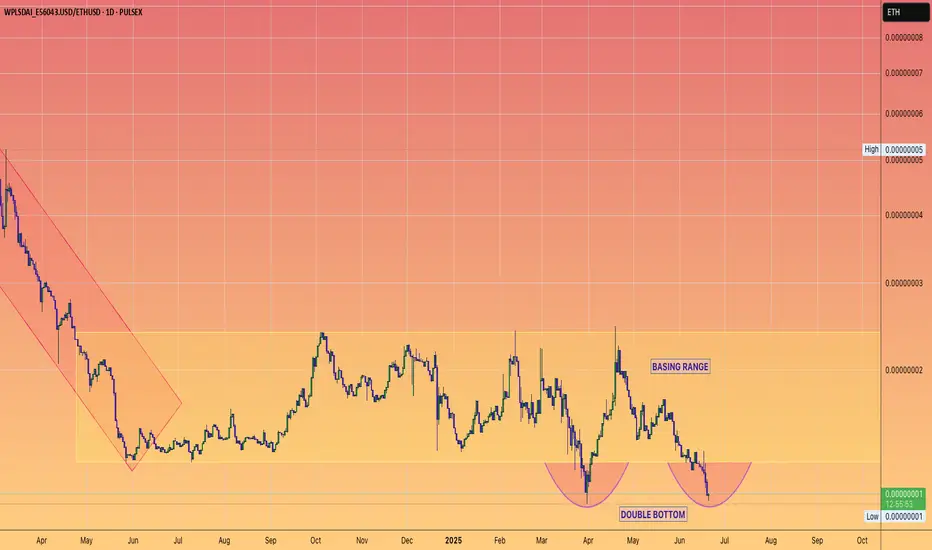
PULSECHAIN v ETHEREUMFirst objective: To get back in the Yellow basing range.
Second objective: Test the upper boundary of the Yellow range.
Third objective: Breakout
Pulsechain's marketcap is less than the ETH that is publicly held by Richard Heart from the PLSX public raise.
Reminder RH beat the SEC
Funds are clear.
Tickers have regulatory clarity as deemed non securities.
Mid July Richard can talk freely if he so wishes.
Irrational prices right now.
Signs of capitulation on Twitter and on chain.
INC
PulseChain Unveiled: Scalability, Speed, & its Strategic Rise PulseChain is an Ethereum fork, aimed at addressing some of Ethereum's limitations like scalability and transaction fees. PulseChain was created by Richard Heart, who is also known for founding the HEX cryptocurrency. After years of anticipation, PulseChain's mainnet went live in May 2023. It was accompanied by significant community interest and a substantial airdrop.
Key Features:
Ethereum Compatibility: PulseChain is a full-state hard fork of Ethereum, meaning it replicates the entire state of Ethereum's blockchain, including all transactions, accounts, and smart contracts at the time of the fork.
Proof of Stake (PoS): Unlike Ethereum's previous Proof of Work (PoW) system at the time PulseChain was conceived, PulseChain uses a PoS consensus mechanism, which is more energy-efficient.
Lower Transaction Fees: One of the primary goals of PulseChain is to offer lower transaction fees compared to Ethereum, aiming to make it more accessible for users and developers.
Faster Block Times: PulseChain boasts faster block times (initially aiming for 10 seconds, later adjusted to 3 seconds) than Ethereum, which was intended to improve transaction speeds.
PLS Token: The native token of PulseChain is PLS, which is used for transaction fees, staking, and governance within the network. PLS tokens were distributed through a "sacrifice" phase where users donated various cryptocurrencies to receive PLS.
WPLS Token: The wrapped version of Pulse on PulseChain, known as Wrapped Pulse (WPLS), is a token that allows the native PulseChain token, PLS, to be used on decentralized exchanges (DEXs) and other platforms where native PLS might not be directly supported. This mechanism essentially extends the use of PLS beyond PulseChain's native network, enhancing its utility and reach across different blockchain ecosystems.
Use Cases and Ecosystem:
PulseX: PulseChain launched with its own decentralized exchange (DEX) called PulseX, similar to Uniswap, which allows token swaps on the PulseChain network.
Airdrops: The launch strategy included one of the largest airdrops in history, aiming to duplicate Ethereum-based tokens and NFTs on PulseChain, offering instant utility.
Validators: Users can stake PLS to become validators or delegate their stake to validators, securing the network and earning rewards.
Purpose: WPLS enables PLS to be traded or used in environments that require ERC-20 or similar token standards for compatibility, like certain DEXs on Ethereum or other blockchains.
Trading: WPLS can be bought, sold, and traded on exchanges, providing liquidity for PLS in different ecosystems.
Bridging: Users can bridge PLS from PulseChain to Ethereum (or vice versa) by converting it to WPLS, effectively allowing PLS to interact with Ethereum's ecosystem.
Availability: WPLS can be found on platforms like PulseX, PulseX V2, and other DEXs, with trading pairs against other cryptocurrencies such as Ether (ETH) or stablecoins.
DeFi: Apart from trading, WPLS can be used for yield farming, staking, or any DeFi application where PLS might not be natively supported.
Technical Analysis:
Presently, WPLS suggests a potential double bottom chart pattern. A double bottom formation is a chart pattern used in technical analysis that signals a potential bullish reversal after a downtrend.
Pattern Formation: It consists of two distinct troughs or lows at roughly the same price level, resembling the letter "W". The price drops to a support level, rebounds, then drops back to the same support level before finally rising again.
Support and Resistance: Between the two lows, there's a peak which forms a resistance level. The confirmation of the pattern occurs when the price breaks above this resistance.
Bullish Signal: The pattern indicates that sellers have tried to push the price down but failed twice at the same level, suggesting that buying pressure is starting to overcome selling pressure.
Volume: Ideally, volume decreases on the second bottom and increases significantly on the breakout above the resistance, confirming the reversal.
Trading: Traders might enter long positions when the price breaks above the resistance, setting stop losses below the double bottom to manage risk. The price target can often be estimated by measuring the height from the support to resistance and projecting that distance upward from the breakout point.
In essence, a double bottom pattern suggests that after testing a support level twice, the market might be ready to move upwards, indicating a shift from a bearish to a bullish trend.
Additionally, WPLS has reentered one of the most critical levels of the broader Fibonacci retracement tool, the 61.8% level or the Golden Ratio.
Golden Ratio: The 61.8% level is derived from the Golden Ratio, which is approximately 1.618 or its inverse, 0.618. This ratio is found in nature, art, and architecture, and in financial markets, it's believed to represent a natural balance point.
Support and Resistance: In market analysis, this level often acts as a significant support or resistance. If a price retraces to this level during an uptrend, it might be seen as a buying opportunity, suggesting the previous trend might resume. Conversely, in a downtrend, reaching this level might indicate a potential last chance for selling before a possible reversal.
Psychological Impact: Traders worldwide use Fibonacci levels, creating a self-fulfilling prophecy where many traders watch and act on the same levels, enhancing their significance due to collective market psychology.
Confirmation: A price reaction (bounce or rejection) at the 61.8% level can confirm the validity of the previous trend. If the price doesn't respect this level, it might signal a weakening of the trend or a deeper correction.
Risk Management: Traders often use the 61.8% retracement as a point to set stop-loss orders or to adjust their risk management strategies, knowing it's a level where the market might react strongly.
The 61.8% Fibonacci retracement level is pivotal in technical analysis because it aligns with the Golden Ratio, acts as a key support/resistance point, influences trader behavior due to its widespread use, and can provide insights into potential market turns or continuations. However, like all technical tools, its effectiveness should be combined with other forms of analysis for more reliable trading decisions.
TLDR:
PulseChain, represents a notable attempt to address Ethereum's scalability and transaction fee issues through its full-state hard fork approach, offering lower fees and faster block times. Its native token, PLS, along with its wrapped version, WPLS, extends functionality across different blockchain ecosystems, enhancing its utility for trading, yield farming, and staking. The recent technical analysis indicates that WPLS might be forming a double bottom pattern, suggesting a potential bullish reversal if the price breaks above the resistance formed by the pattern's peak. Furthermore, WPLS's reentry at the 61.8% Fibonacci retracement level, known as the Golden Ratio, adds another layer of significance, potentially acting as a critical support or resistance point. This confluence of technical indicators points towards a pivotal moment for WPLS, where the market could see either a resumption of the prior uptrend or a deeper correction if the levels are not respected. However, while these patterns and levels provide valuable insights, they should be approached with caution, ideally in conjunction with broader market analysis, due to the volatile nature of cryptocurrency markets. The success of PulseChain and WPLS will ultimately depend on ongoing network performance, community support, and the broader acceptance within the DeFi ecosystem.

new kid on the block pulsechain mainnet token $plsOptimistic for this fork of ethereum chain, Pulsechain has a big community and fan base. still early for technicals, but for me im buying a big bag and hodling, im expecting some upwards movement, from the bottom of this wedge, the weekends have lower volume then during the week, so it could go sideways, faster, cheaper, smoother than ether, ASX:PLS OSL:HEX AMEX:INC $plsx

TWTR analyseTWTR in 15minut indicate that the market is bullish next phase and that good time to buy in the market

CGI stonks in correction wave phase After checking monthly chart for CGI stonks I saw that Elliot's cycle has been finished and now it's time for A wave.

MITSUBISHI UFJ FINANCIAL GROUP INC Month
MITSUBISHI UFJ FINANCIAL GROUP INC big volume green I think that pullbeack

Ready to fly the chart show Braking the trend line and ready to fly ,
after pullback to the trend line we are ready to see a good grows in price

CGI INC Share Canada Stock Markethi friends
GIB.A (Canada Stock Market Share )
in Great Demand Area And Ready For Great Long to Target With
RR=1:5
SL and TP is Drawn but Target Can be Expanded but dont Forget to Save Profit At Least 70%

GOOGLE - Monthly ChartEngulfing candle on the previous close, any significance will be confirmed on the weekly.

Pinterest (PINS) | Approaching a Strong Support/Rejection ZoneHi,
Pinterest is dropping into quite a bloody streets but we have quite a strong criteria of support which can lead the price into reversal. Do your own fundamental research, I'll give you a technical confirmation.
Regards,
Vaido

AAPL - Daily Setting UpAAPL
BUYZONE = 123 - 125
Cost Avg Down (CAD) = 110
1st Target = 138
2nd Target = ATH
3rd Target = 166+
This content is for informational, educational and entertainment purposes only. This is not in any way, shape or form financial or trading advice.
Good luck, happy trading and stay chill,
2degreez


Triple Indication for AAPL Breakout NowThere are three indications to AAPL rising and breaking out to new all-time highs. The MACD crossover, The pattern we saw on the stock chart and finally the rsi moving up like it did last time there was a breakout. Could this mean a breakout? This is an update to my previous post. Warning! I am to a financial adviser and Investing is risky. Happy trading!

There GOES...REMGRO!Remgro remains one of my favourite “SA Inc” type of company by a country mile. Even after a 16% run over the past week, still leaves the company trading at a current discount to its intrinsic value of over 40% (compared to an average 10-year discount of 15.6%). We therefore firmly believe in the longer-term opportunity REM offers, even at current prices. Also, read our recent report on the company: oldoak.co.za
Technically, the resistance level of R96.50 which REM struggled to convincingly break, since July this year, has now been broken, with a run to its 200-day Moving Average (EMA) at R115.75, now becoming highly likely. REM’s 14-day RSI however is getting awfully close to EXTREME OVERBOUGHT levels, which might not make this a “straight line to glory” yet. We could therefore see some profit-taking soon, which could see me reload on some more.

First Solar, Inc Stock Ready for Growth !Trade Analysis based on Fundamentals and Price Action.
With Risk management you Will Never Loss.
Thank You.

Both sides of the spectrum - TSLA & ARSN (not the felony)TSLA! Long and strong, treating us super well. With the market at ATH, we are literally in uncharted territory. With that said, lets take advantage! As always, tight stoplosses! Lets not give back all that hard earned cash.
Ive had my eye on this for some time, and this week They PRed which has finally helped the bulls put up some epic battles over the bears on the tape. Some calling for $.01? Who knows. Hard buy. Yuengling Ice Cream, believe me it looks as gross as it sounds, But apparently Walmart thinks otherwise.

FSLY looking for a top in wave bFSLY still looking like a corrective move at this point. Still think a higher wave b then move towards a lower then 74 C. Could be that its overall corrected but not my most likely count right now.

ADOBE, Major Break Below Key Trendline, Continuation Possible!Hello Traders Investors And Community, welcome to this analysis about the stock market and a single stock value ADOBE INC, we are looking at the 4-hour timeframe perspective, the recent events, the current interesting formational structure and finally what we can expect from the stock the next days, hours and weeks. I already mentioned PAYPAL some days ago which is actually building a really similar formation to the one in within this stock, I highly recommend you to watch this to have a full-depth-overview and a suitable to this stock, furthermore, this does not mean the whole stock market is building the same structure there are stocks which looking still bullish and strong while stocks which even did not rally and trading below the established all-time-highs.
As you can watch when looking at my chart is that ADBE INC just fell below this meaningful trendline which is marked in red, this trendline held the whole uptrend to the upside and is now broken to the downside which is firstly a strong bearish signal, besides that the breakdown occurred with high volume as you can see in my chart which is increasing the strongness of this move. Another factor which is also confirming the actual current bearish pressure is the fact that ADBE INC builds a possible head and shoulder reversal top formation here which you can see marked with the blue neckline and the other details of this formation, currently forming the right shoulder of this formation.
Taking all these signs into consideration we can assume that the volatile bearish breakdowns seen since the established highs aren't over yet and a great possibility is given for continuation to the downside when the head and shoulder confirm properly. When this happens and the neckline breaks to the downside the head and shoulder target zone marked in green in the 370-365 level will be activated. On the way to this target zone, there is still strong resistance formed by previous highs at 385 but when the trend is strong enough this can only play a marginal role. Overall it is a high possible bearish setup when the head and shoulder confirms which can be traded either aggressive with immediate entry or conservative with an entry below the neckline confirmation.
As more than one stocks in the bigger market cap stocks showing these bearish signs which before showed strongness and rallied to new highs, it should be considered with caution because it can indicate a follow up of other stocks in the large market-caps which can signal a possible bearish shape in the rest market, as the corona pandemic is still going on and a second way is not from the desk we should not keep the bearish perspective out of the sight now as the S&P is still below its all-time-high and did not confirm the full bullish continuation and bear-market-ending till now. We will examine how this whole situation develops and if these are just correction or resulting in bigger and stronger bearish environments concerning other stocks and main market also.
In this manner, thank you for watching, support for more market insight, have a great day, and all the best to you!
Enlightenment is under our feet as well as over our heads.
Information provided is only educational and should not be used to take action in the markets.

OVER RATE we can see stock price has been starts rejection ,,,, why
my opinion because of over rating right now and price must back to value area at least just maybe will take time on the range of value area before strong move up or down
to make another accepting price the POC
JUST KEEP IN MIND
NEWS OF EXPECTING the TESLA become under S&P500 then all this scenario will change and bullish will lead over and over again

FSLY wave Bbased on movement today I'm leaning toward A being in and looking for slightly higher B at this time

Apple is waiting for a short-term growth!This analysis has low power.
The company expects a short-term growth of 370.98.
Then we expect the price to drop to 342.67.
On the other hand, the price may fall and break the line of Keijunsen and Tenxen and decrease until the Komo cloud.
Signal by Yazdani

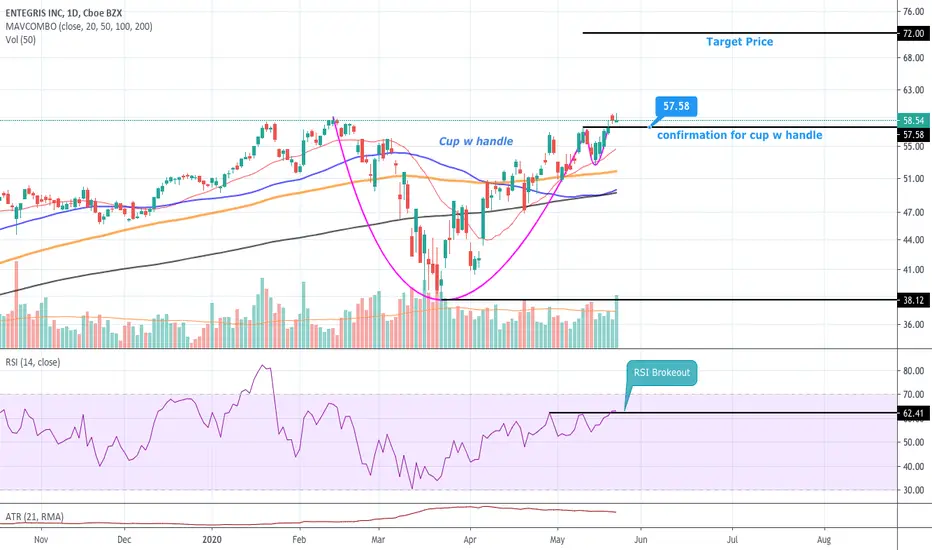
ENTEGRIS $ENTG cup w handleIt confirmed the buy point of cup w handle. RSI broke the resistance as well and the volume is well above the average.
If you like my charts, please leave me "like" and make "comments"
thx