SPX and NQ - are we there already?I am cautiously optimistic that the the correction that started since mid July could be finally over and we could begin to see more ups rather than downs going into the final 2 months of this year.
SPX did come very close to its H&S target while NQ was 4% shy of its H&S "target" (close enough though!) before we had a bullish reversal this week.
One could still argue that this could just yet another "sucker's rally" (aka bull trap) that we have seen numerous times in the past 3.5 months.
However, there are a few factors that gave hope for medium term bullish bias this time:
1. A pretty bullish (large body with almost no wicks) weekly reversal candle, though still in the making for this week
2. Both SPX's and NDX's Weekly RSI could be breaking out of their downward trendline, which often could be an "early" signal of strength in the coming weeks.
Non-technical aspects:
3. More earnings announced this week have been beating market expectations and their stocks are now bouncing off a lower base.
4. Fed announcing a pause in in interest rate hike yesterday.
That said, we still need to see the indices breaking above their strong trendline resistences (shown in Red) for a confirmation that the "correction" could be over, plus there is always a chance that the trend going forward could remain sluggish despite no longer "bearish".
Let's see!
Disclaimer:
This is just my own analysis and opinion for discussion and is NOT a trade advice. Kindly do your own due diligence and trade according to your own risk tolerance and don't forget that money management (ie trailing stop loss and position sizing) is (probably the most) important!
Take care and Good Luck!
Index

CHINA A50: Bullish signal approaching.The China A50 index reached today the LH trendline of the August 1st top and turned neutral on the 1D technical outlook (RSI = 50.831, MACD = -120.000, ADX = 25.828). The 1D MACD Bullish Cross that was just formed on such a low level, makes the third time this year but we need further confirmation to buy for an extension as the March 23rd Bullish Cross failed to push the index past the 0.382 Fibonacci level.
Consequently, if the price closes a 1D candle over the 0.382 Fibonacci, which at the same time will be a 1D MA50 breakout, we will go long and target the 0.618 Fibonacci level (TP = 12,800), which will be a technical LH of the 10 month Channel Down.
## If you like our free content follow our profile to get more daily ideas. ##
## Comments and likes are greatly appreciated. ##

Can The Dollar Push Higher? Hey traders, welcome back.
The dollar is increasing heavily to the upside as I make this video.
Now we don't know how price will close but it is important to watch how she closes today.
If price continues this could affect the major currency pair market in a mighty way.
All Base dollar pairs could continue to increase while Quote dollar pairs could continue to decrease.
It's a patience game right now, but may be one to play if you have the right hand.

NASDAQ Rebounding on the 1D MA200 and targeting 15,000Nasdaq is trading inside a Channel Down since the July High and is naturally on bearish 1D technicals (RSI = 39.169, MACD = -233.06, ADX = 37.454). This is a buy opportunity though as the price is rebounding today after making a LL bottom almost on the 1D MA200. That is a long term Support level, being unbroken since March 13th. The second bottom indication is given by the 1D RSI which hit and bounced from inside the S1 Zone, as both previous bottoms have.
Every rebound rose almost as high as the 0.786 Fibonacci level to make a LH top. Consequently we turn bullish and target that Fib level (TP = 15,000) which is slightly over the 1D MA50.
## If you like our free content follow our profile to get more daily ideas. ##
## Comments and likes are greatly appreciated. ##

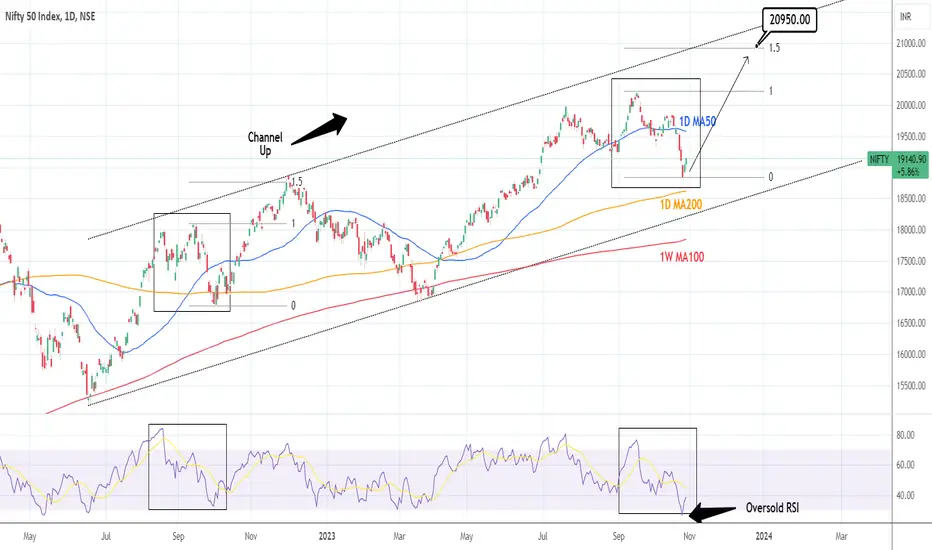
NIFTY Shifting to a long term buy.Nifty 50 turned oversold last Thursday on the 1D technical outlook and that attracted investors which restored the timeframe from oversold to just bearish (RSI = 38.950, MACD = -141.600, ADX = 34.223). This shows considerable buying strength, a little over the 1D MA200, a support level that is holding since April.
The price action look very much like August-September 2022, when again a nearly oversold 1D RSI on the 1D MA200, kickstarted a rise to a HH on the 1.5 Fibonacci level. We see a similar trend emerging, so take this opportunity to enter in its start and target again the 1.5 Fib (TP = 20,950).
## If you like our free content follow our profile to get more daily ideas. ##
## Comments and likes are greatly appreciated. ##
FTSE Short Most indexes are looking to be short right now, this Index is overbought and has multiple tops with divergence. There is no pattern on this trade, but this is with the trend so it should fall to the bottom and bounce back up. Stop loss is 50 pips and the aim is around 10.

Long position US100 We see that the Nasdaq index has left its upward channel and is correcting yesterday's movement, and we can follow it on the upward path.

Tesla need rest for shourt timeTesla could continue its correction up to $168 and after hat can be again to the top

DXY D1 - Short SetupDXY D1
Today, or at least this morning is all about waiting for these corrections to unfold and settle. The DXY is being used to compare against FX pairs, and we are just waiting to see whether this resistance price holds, or breaks.
Like I say, we aren't looking to trade just yet, merely try and get some consensus of direction early on in the week, we can then trade off the back of that.

DXY US INDEX LONGhi traders as i can see a very simple view on Dxy chart
that the bullish move is still going to complete the given level
if we watch deeply in the chart the DXY holding a strong support zone with a strong data of CPI & NFP with FOMC meeting minutes then its an easy target for incoming days
Kindly share ur thoughts via comment session...
stay tuned for new updates

S&P500: Megaphone buy opportunity.S&P500 is almost technically oversold on the 1D timeframe (RSI = 30.205, MACD = -54.210, ADX = 37.499) with the price reaching the 0.618 Fibonacci level from the March 13th Low. The last time the RSI was at 30.000 was on October 3rd, the previous LL of the Bearish Megaphone pattern. The two bullish sequences of this pattern have been around +4.60%. Since this is a double bottom signal, we expect a rise of equal proportion, targeting the 1D MA50 (TP = 4,315).
See how well our prior idea has worked:
## If you like our free content follow our profile to get more daily ideas. ##
## Comments and likes are greatly appreciated. ##


DAX: Amazing Channel Down symmetry calls for a buy.DAX hit (even breached) the bottom of the Channel Down on the 1D timeframe and reacted with a rebound. It is not a strong one yet as the 1D technical outlook is still bearish (RSI = 34.478, MACD = -177.100, ADX = 34.069) but the remarkable symmetry with the two bearish legs prior, calls for a currently undervalued price for the short term.
Technically the two rebounds after making LL inside this Channel Down, reached a little over the 0.5 Fibonacci level. The buy signal becomes even stronger if we take into consideration that we got the first 1D RSI Bullish Divergence. We are buying having a modest target on the 0.5 Fib (TP = 15,100), which depending on how aggressive the current reaction is, can even reach the 1D MA50.
See how well our prior idea has worked:
## If you like our free content follow our profile to get more daily ideas. ##
## Comments and likes are greatly appreciated. ##

US500 - Detailed Video Analysis 📹 From Weekly To H4Hello TradingView Family / Fellow Traders. This is Richard, also known as theSignalyst.
📈 Here is a detailed update top-down analysis for #US500.
Which scenario do you think is more likely to happen? and Why?
📚 Always follow your trading plan regarding entry, risk management, and trade management.
Good Luck!.
All Strategies Are Good; If Managed Properly!
~Rich

DOW JONES: Support Zone intact. Buyers are favored short term.Dow Jones is volatile on the 4H timeframe (RSI = 37.485, MACD = -170.620, ADX = 29.943) after almost testing the S1 level (32,813) yesterday but following a 4H MACD Bullish Cross formation, it is a low risk buy opportunity. The rejection of the previous rise took place on the 4H MA200, so that is our target again. Buy and TP = 33,700.
## If you like our free content follow our profile to get more daily ideas. ##
## Comments and likes are greatly appreciated. ##

SP500 - long positionHello traders, SPX charts looks bullish. We can see in the chart price forming a bullish reversal pattern backed with RSI bullish divergence on daily time frame. If this daily candle close like this, it means bullish engulfing candle formed and we are most likely to see a nice reaction to the up-side from here.
Entry price: here
Targets. above (red lines)
Stop loss: below wick
Good luck :)

BTC Dominance IndexThe BTC Dominance Index is an indicator that shows bitcoin’s share in the total capitalization of cryptocurrencies. The higher dominance is, the more considerable influence of BTC on market
According to the analytical website Coinmarketcap, the total value of all cryptocurrencies in the world is $985 billion, of which $380 billion, that is 39.5%, accounts for bitcoin. This index is called the “dominance of BTC”. The TradingView service began calculating the index in March 2014, and during the first three years, the index was at a level of more than 95%.
In 2017, the ICO boom began, after which retail investors started actively investing in altcoins. This caused bitcoin’s dominance to fall and the capitalization of other crypto projects to rise. During the “bear cycle”, when the crypto market was in decline in the 2018-2020s, BTC’s dominance was growing, but the price of bitcoin itself was declining. This is because the volatility of altcoins is much higher than that of the main cryptocurrency. Due to this, altcoins rise more in a bull market and fall more in a bear market.
BTC dominance does not necessarily correlate with the price. When bitcoin’s value falls, and other cryptocurrencies’ prices fall at a similar rate – BTC dominance will remain at the same level.

What the 4,300 Mean for the S&P 500The recent price action on the S&P 500 has been very interesting. While the long run outlook for this index is up, the recent price action tells a different story.
The S&P 500 experienced an excellent bull run from April 2020 to December 2021. The year 2022 was shaky with huge whipsaws at just about every other month.
2023 looks like we might be getting some stability as the S&P 500 resumes its uptrend. That is, until it entered the range previously formed around the December 2021 high.
Things took an interesting turn as this week ended with a huge selloff. This is an indication that the 4,320 to 4,360 range (see the rectangle) is holding and acting as resistance in the formation of a lower high.
If this level holds up, then it's very likely we begin to see a downtrend for the next little while. Which, by the way, will be supported by a moving average cross-over as confirmation.
Given the fundamentals that we're seeing, this is a real possibility. Consumer income growth falling short of inflation. Corporate layoffs driven by the technology sector show no signs of stopping. Hiring freezes are beginning to take place. Finally, more and more people are dipping into savings and credit to either meet bills or maintain the lifestyles they can't afford.

$DXYCAPITALCOM:DXY
good dayAccording to the chart of the financial markets, the dollar index has the potential to grow up to the range of 104
At the same time, all stocks will fallWatch the news
According to what I said, my prediction is the increase of interest rates and the strength of the dollar in the above time frame.

S&P500: A rare buy opportunity within this MA zone.S&P500 is making contact today with the 1D MA200 for the second time in 2 weeks. The 1D technical outlook is naturally bearish (RSI = 38.503, MACD = -22.450, ADX = 29.479) since the 3 month pattern is a Bearish Megaphone and we are on the third selling sequence. It is not necessary to make a new direct hit on the LL trendline as the utmost technical support level in long term uptrends is the 1W MA50 and is where the second and last buy entry can be attempted. Our target is the 1D MA50 (TP = 4,360).
See how well our prior idea has worked:
## If you like our free content follow our profile to get more daily ideas. ##
## Comments and likes are greatly appreciated. ##

DAX: Rebound expected to test the 1D MA50.DAX is trading inside a Channel Down since July 31st and lately has been on the decline after a rejection on the 1D MA50. Naturally, its 1D technical outlook is bearish (RSI = 38.140, MACD = -103.800, ADX = 23.717) but also low enough to justify a short term rebound.
We expect one last 1D MA50 that will decide the long term trend and based on the previous -6.50% pre-bearish leg, this should be on the 0.786 Fibonacci level. That is marginally under the top of the Channel Down and that is our target (TP = 15,450).
See how well our prior idea has worked:
## If you like our free content follow our profile to get more daily ideas. ##
## Comments and likes are greatly appreciated. ##

$DXY : uptrend will continue?After retail sales come in stronger due to climbing wages and other strong data from the US I expect that the Dollar index will get momentum, and show strength a couple of weeks ahead

Silver 4H price gathers positive momentumHello everyone, The silver price is showing noticeable positive trading to approach our expected target of 22.71, and we remind you that exceeding this level will lead the price to achieve additional positive targets of up to 22.96in the near term.
Pivot Price:22.71
Resistance Price: 22.96 & 23.14 & 23.38
support price: 22.21 & 21.95 & 21.71
The general trend expected for today is bullish
Timeframe: 4H
