Patterns In The US Dollar Index!Hello Traders Investors And Community, welcome to this analysis where we are looking at the US Dollar Currency Index 12-hour timeframe perspective, the patterns formed in its established downtrend, the current pattern forming which can alter the dynamic, what the index needs to show to alter the dynamic and how possible outcomes can look like. The index is still trading in a well-established downtrend forming one bearish formation after another, in such downtrends is a big question sophisticated traders should ask us when these downtrends ending because they can't go on forever as the relative strength dynamic getting in the oversolid region and the price normally reverses sooner or later such a possible reversal I detected also in the index now where I found the importances we should take into consideration for further possible outcomes and how they can show up like.
Looking at my chart you can watch there that the index is building a possible bullish reversal formation since a long time now which can possibility to reverse the dynamic and turn the established downtrend into bullish , in this case there are some importances which need to be fulfilled in order to show up with the complete confirmation, once it is the breakout of the upper boundary of the possible ascending channel to the upside which does not necessarily mean the index will completely continue bullish to the upside as there is still the primary resistance-line lying marked in blue within my chart, where the index has to show if it can move above the resistance or bounce back again, when the index shows up with this there is the secondary resistance-line which also needs to be taken out, when this happens the structure can be confirmed into the bullish range above the last resistance line.
Sometimes such formations can also invalidate to the downside, in this case, we are speaking of a fake descending-channel-formation, this will happen when the lower boundary is completely broken to the downside with a volatile bearish move, therefore it is from high importance to wait on the proper confirmation of the triangle before moving in the direction. When the index does not show up with the proper confirmations a higher possibility is given for continuation to the downside confirming into lower levels in the range, we will see how this will play out and how the index will develop next times, especially when considering new volatile movements entering the market regarding corona increase again which already provided high volatility this year this can lead to some volatility where the index goes into the opposite direction like other antyciclical assets like stocks.
In this manner, thank you for watching, support for more market insight, all the best!
Information provided is only educational and should not be used to take action in the markets.
Index

D-JONES, Gap Will Fill Soon, Possible Reversal Ahead!Hello Traders Investors And Community, welcome to this analysis where we are looking at the DOW JONES 4-hour timeframe perspectives, the upcoming decisive events in the structure, what we can expect after these events occurring and how possible outcomes can show up in the schedule. The DOW like other major indices recovered somewhat from the corona-breakdowns and lows seen this year where the SPX already made a new all-time-high the DOW is below it and although the indices recovered we should not ignore the fact that the rallies aren't necessarily fundamentally backed as many retailers rushed into the market smart-money staying outside and waiting on the sidelines, not to mention the divergence between real economy and stocks it is important that smart-money enters also where the question pops up if the breakdowns are already over or there is more to come, these facts also coming up in the technical picture of the DOW which is sending some interesting signals at the moment I detected how they possibly can play out over the next times.
Looking at my chart you can watch there that the index is just about to fill its gap which it still has lain there at around the 29.000 level, this gap-fill will highly possible play out the next times and this is also confirming on the smaller timeframes as the index is forming a triangle formation, this highly possible gap-fill can be traded in the long-side with overall targets at the 29.000 level from where the next moves are significantly important. Normally what happens often after such gap-fills reaching the gap and filling it is that supply entered the market as orders get filled and traders take profit, this is what also can show up here making the gap-fill-range around 29.000 a possible short-entry-zone as it is marked in my chart, what is supporting this preliminary pull-back is the fact that the index also ending with a wave-count in this level. This pull-back-scenario will be confirmed when the rising grey trendline is broken with a decisive volatile move to the downside the targets at the blue range can be expected where a support-cluster is lying in which the price can stabilize and back-up.
In this manner, thank you for watching, support for more market insight, all the best!
Information provided is only educational and should not be used to take action in the markets.

Nas100 Bullish Possible break of Daily Zone
*Here we have a possible break of the daily zone.
*We are waiting for a pullback that comes from the key price level @ 15500.
*Stop loss is tight under Mondays low expecting this to be the low of the week
*If trade is missed, look for entries on the 1hr and 15m timeframes

✅VIX RISKY LONG🚀
✅VIX is going down to retest a horizontal support of 12.8$
Which makes me locally bullish biased
And I think that we will see a rebound
And a move up from the level
Towards the target above at 13.5$
LONG🚀
✅Like and subscribe to never miss a new idea!✅

BABA, Breakout Of Triangle, Next Steps Ahead!Hello Traders Investors And Community,
Welcome to this analysis where we are looking at BABA 4-hour timeframe perspective which is has shown some interesting confirmational and volatile signs recently, therefore, we are looking at recent events, the current price-structure, what we can expect next times, how possible entries can look like and how to handle upcoming situations properly.
Looking at my chart you can watch there that the stock just formed this massive and decisive ascending-triangle-formation which upper boundary and lower boundary are marked in blue, as this triangle has confirmed now properly with a volatile bullish move to the upside this gave a good and healthy edge for further upside ahead. Currently, the stock is approaching some resistance in the level where a pull-back to the upper boundary of the formation is possible as it is seen in my chart, furthermore, the stock has some solid support in this range which is given by the 50-EMA marked in red and below still the 100-EMA in black, these factors making it highly possible support to be confirmed when touched in this area, it is also a good point to open long in this range as it is marked in my chart, with the breakout the stock activated the minimum target which you can watch marked at the 299-300 level, when the stock approaches this it has to be elevated how it will continue further in the range, overall there is definitely some more upside possible.
Although it is possible to increase further in growth above the minimum target it has to be elevated how the stock approaches this range and if there are urgent bearish signs in this range, how they look like or the stock just manages to move above this level and go further.
In this manner, thank you for watching, support for more market insight, all the best!
"Trading effectively is about assessing possibilities, not certainties."
Information provided is only educational and should not be used to take action in the markets.

SPX, Formed New All-Time-High, These Scenarios To Consider Now! Hi my friends,
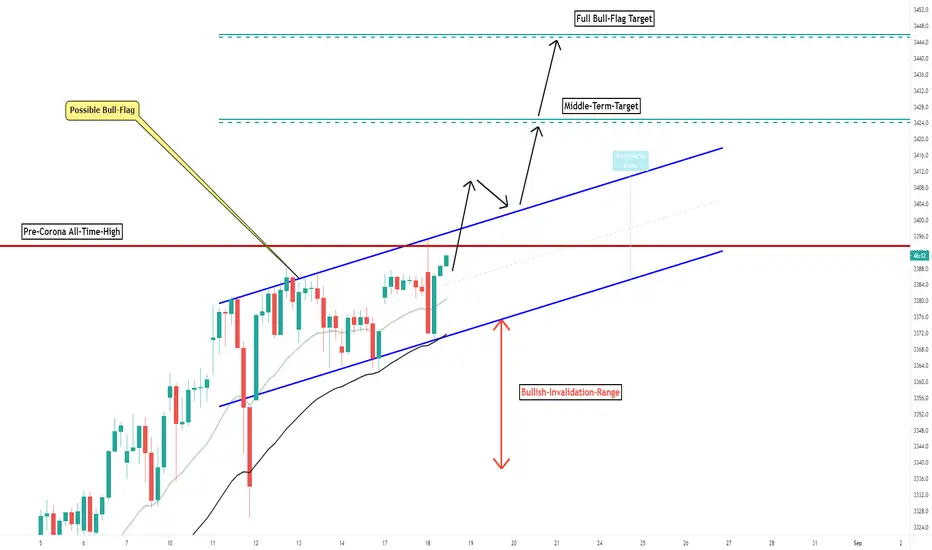
Welcome to this 1-hour timeframe perspective SPX update, the index recently confirmed a new all-time-high which exceeded the pre-corona all-time-high, now the index is in a decisive situation as the price just pulled backward right after the breakout which can indicate a bull-trap, a close above the level would have been a stronger move now the index has to show certain price-action to make it a sustainable breakout or decline will set in.
You can see in my chart the possible bull-flag the index is forming here marked in blue with the new all-time-high marked just touching the upper boundary of this bull-flag-formation, what is important now to confirm this bull-flag rightly is to move above the established high and close above the upper boundary of the possible bull-flag otherwise when this does not happen and the index fails here this can just be a bull-trap which reverses course to the downside, this will show up when the index moves below the lower boundary and below the 40-EMA marked in black but as the index still holding above these supports the bullish breakout scenario is more likely. This ongoing mechanism can be traded either aggressively with an entry in the bull-flag or conservative when entry after confirmation, although the aggressive entry, is possible the conservative will be much better as the price confirms the formation and activates the targets.
Next times will show if this new established high will sustain and follow up with new highs or this was just a huge bull-trap invalidating to the downside, what is important to keep in mind that there are still big divergences between real economy and stocks while the real economy is damaged stocks making gains this can lead to a speculative environment, therefore we need to elevate further and if SPX manages to move above the range and form new highs how it establishes there as fundamental factors not necessarily supporting a rally.
In this manner, thank you for watching, support for more market insight, all the best!
Information provided is only educational and should not be used to take action in the market.
CISCO, Possible Inverted H&S, These Level To Consider Now!Hello Traders Investors And Community, welcome to this analysis where we are looking at the stock value CSCO (CISCO) 4-hour weekly timeframe perspective, the recent events, the current meaningful formation building, what to expect the next times, which level are important to hold and how to handle upcoming situations out of a trading perspective. CSCO was since the corona crisis technically one of the weaker stocks trading below the 55-EMA measure and way below its established all-time-high, now this does not mean it is bearish forever and continue as I detected some signals which can indicate a follow-up of this stock to the main market, but the importance in the CISCO environment here is that it needs to confirm certain levels before such a follow-up can be considered at all but when these conditions fulfill the stock has some potential in the current structure building up.
In my chart, you can watch that the stock just forming somewhat of a correction currently where it is correcting the uptrend established since the corona bottoms seen this year, the incoming volatility is higher but it can slow down when nearing to the support in the structure which the stock has at the 300-EMA marked in black where also important Fibonacci-supports lie. Therefore it is important that the stock bounces here and it is a needed condition in order to complete the big possible head and shoulder formation seen in my chart marked in blue, which will confirm when the stock stabilizes at the EMA and bounces from there, this move is highly important because when this does not happen and the stock falls below it this invalidates the whole head and shoulder formation within the invalidation range marked with the arrows in red where the stock will increase bearishness in this area.
When the stock manages to hold the EMA support and bounce from there a move towards the blue neckline can be expected, when this happens it is important to move above it the best with a volatile upside move closing above the neckline which will confirm the inverse head and shoulder formation which will provide the proper entry setup for entering a position here as this is seen in my chart, in this case, the stock can bounce from the 55-EMA in green which will be a good point for opening a position, although the aggressive immediate entry approach is also possible here the conservative will be better to wait on the confirmation and then enter. When this scenario is playing out properly there can be decent upside targets expected which can even exceed the established all-time-highs therefore a smart consideration to open positions before the masses enter, remember to wait on confirmation which is the best process here.
In this manner, thank you for watching the analysis, support for more market insight, a good weekend and all the best!
"Trading effectively is about accessing possibilities, not certainties."
Information provided is only educational and should not be used to take action in the market.

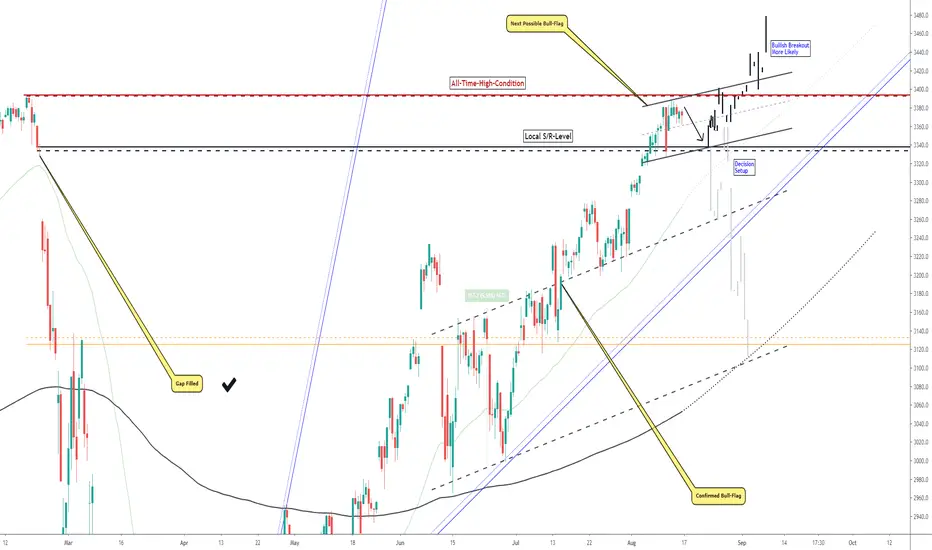
SPX500, Trading Between The Lines, Breakout Or Pull-Back?!Hello, Traders Investors And Community, welcome to this analysis where we are looking at the SPX500 4-hour timeframe perspective, the recent events, the current formational structure, the upcoming price-actions, and how to handle the situation. As the stock market has recovered from the heavy corona-breakdowns seen this year many people looking at the major S&P 500 index and think what it will do next, the big question is now if the index can succeed in making a new high despite the still damaged real economy or if the bearishness sets in again supported by a second corona increase and the following measures taking place. In order to look at this problem in the right manner, we should keep in mind that the real economy and stock-market still showing big divergences to one another, while the real economy is still damaged and in a set-back due to coronas breakdowns the stock-market making gains mainly of the retailers rushing into the market while smart-money staying outside which can lead to a speculative market environment which need to be fixed in order to provide healthy growth in both factors.
The indecision and divergence can also be seen not only in fundamental aspects but also technical as you can watch examining my chart the index has formed a bigger bull-flag already which confirmed to the upside, filled the gap and noted above this level where it is now somewhat consolidating and forming another second possible bull-flag, which is smaller but it can show a more decisive breakout as the bull-flag is forming right slightly below the all-time-high-condition you can watch marked in red. This fact can either mean that the bull-flag will follow up with a strong upside breakout providing new all-time-highs or with a break below and a possible double top which can move the price way lower in the structure. As the index still has some solid support levels in the range forming with the S/R-level marked in black and the 55-EMA we can come to the conclusion that a bullish upside breakout is more likely and possible as the downside one because the index firstly has to take out the remaining supports where it will have a hard time to do so, in this case, the upside breakout after consolidation can be more expected.
When the index shows up with the more likely upside breakout this does not mean the index is completely bullish as this can still be a bull-trap and furthermore the index is trading in a weak uptrend with slowing down momentum which needs to increase when the breakout to the upside should be sustainable and last away, much more important than this is the fact that the real economy needs to grow together with the stock-market to make it a solid breakout and continuation potential with upcoming prosperity as it was seen in the past, we just have to imagine that the market needs to grow also without money printing into the market from central banks and on which point the price would be without these substitutions. Such mechanisms just ensure that a bigger crash postpones sooner or later as the situation gets intolerable we should see the current rally and possible breakout with continuation in a critical light to not get overwhelmed by circumstances if the environment reverses to the other side as this was factly true with many happening this year.
In this manner, thank you for watching the analysis, support for more market insight, a good weekend and all the best!
"There are many roads to prosperity, but one must be taken."
Information provided is only educational and should not be used to take action in the market.
GOLD: Bulls Will Push Higher
Looking at the chart of GOLD right now we are seeing some interesting price action on the lower timeframes. Thus a local move up seems to be quite likely.
❤️ Please, support our work with like & comment! ❤️

FTSE 100, Consolidating, This Scenario Can Alter The Situation!Hello Traders Investors And Community,
Welcome to this analysis where we are looking at the FTSE 100 Index, what it is currently doing, the overall formation, the possibilities when certain confirmations occur, and how to handle upcoming changes. The FTSE is an index which has developed a longer consolidation period after its recovery approach from the corona breakdowns seen this year, the big question as it is also the same in other major indices is if this recovery can sustain further within a healthy unspeculative market environment or if there is more downside ahead especially when an increase in corona shows bearish downside action similarly to those mechanisms seen this year.
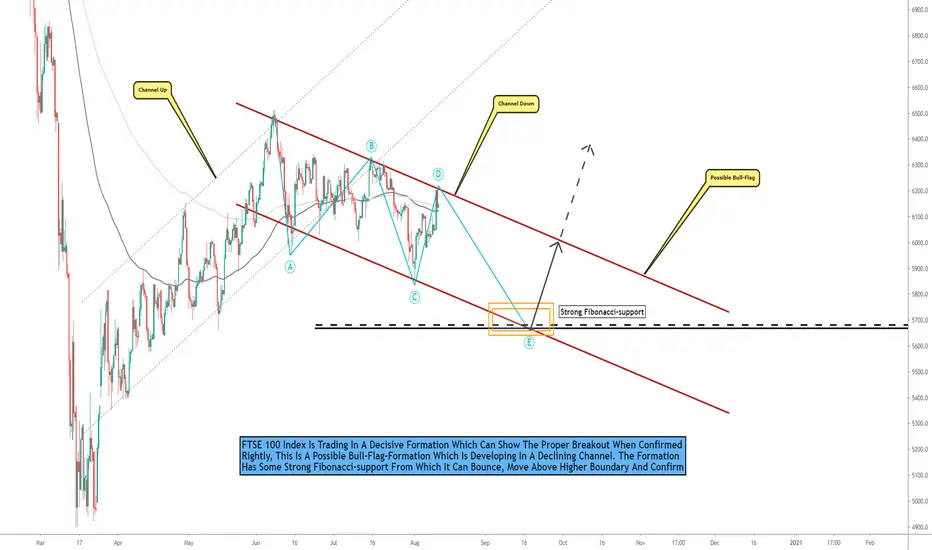
Looking at my chart you can watch there that the index is trading in a longer stretched descending parallel channel which is marked in red where it is consolidating slightly to the downside and already touched the upper and lower boundary several times, such formations tend to break out sooner or later and the longer such formations develop the heavier and more volatile the breakout will be. Technically speaking the consolidation can go on more time when there is no positive news event which is altering the situation immediately to the upside, furthermore, the wave count establishing supports this scenario where the final wave E can form over the next times while the upper boundary confirming bearish again this final wave is not far away and within the high possible range. When this happens and the final wave develops the index has some solid support at the Fibonacci-support seen in my chart which is the 50 % level of the whole wave up, this support is also matching with the lower boundary of the channel where a bounce can be given and expected. When the index bounces in this area it can move on to confirm the bull-flag which will activate targets way above the range but the importance is to show up with the confirmation.
This possible bull-flag breakout can confirm a healthy bullish edge but that does not mean the whole index is completely bullish as there are still strong resistance levels and the index is trading way below its all-time-high-condition, therefore we should not keep the bearish scenario fully by side here, the bull-flag can confirm bullishness on the short and long-term but that does not mean it will definitely go up into the long term as well, in this case the bull-flag can be traded on the long-side but it should be seen crucial when it is approaching resistances in the range above.
In this manner, thank you for watching the analysis, support for more market insight, and all the best!
Information provided is only educational and should not be used to take action in the market.
HD, This Formation Is The Crucial Factor For Futher Outcomes!Hello Traders Investors And Community, welcome to this analysis where we are looking at the stock value HD 4-hour timeframe perspective, the current formation and what to expect from this stock the next times. Although HD has formed some new highs it is struggling at the moment as the volatility gets extremely low and the price weakens it can be possible to reverse, in such environment it is important to note that there are stocks which gained strongly out of the corona crisis and stocks which showing bearish signals, as HD has shown some bullish signs this can reverse to the other side now therefore I detected some important signs to consider which will determine the further outcomes.
Looking at my chart you can watch there that HD has formed this huge possible rising-triangle-formation which is marked in blue where the price already severaly touched the lower and upper boundary within its low-volatile movement, what is important is this movement as it gets slower and slower here the price struggles to advance, such movement can suddenly reverse which is also playing into the rising-triangle-structure the stock is building up here. This triangle will confirm when the price closes with a volatile move below the lower boundary and therefore confirms the triangle, a continuation to the downside will be highly possible and should be considered when this happens.
When the more likely bearish scenario plays out here the stock will look for remaining supports which is firstly the 100-EMA marked in red which is a possible support that can hold and when it does not the next support will be at the 300-EMA marked in black, in these levels the stock can reverse and possibly continue bullish on the middle or even on the long-term but this has to be confirmed rightly. Although a immediate aggressive approach is also possible here such formation can be traded best possible with a confirmation of the whole triangle-formation with a close below the lower boundary and cotinuation, it will be highly interesting how this is playing out in the current structure.
In this manner, thank you for watching, support for more market insight and have a good day!
“The fundamental law of trading is the forecast of the future.”
Information provided is only educational and should not be used to take action in the markets

SPX500, Major Gap Has Been Filled, What To Consider Now!Hello Traders Investors And Community, welcome to this update-analysis where we are looking at the S&P 500 4-hour timeframe perspective, the recent events, the gap-fill occurred, what to consider now and what are possible outcomes further next times. The major gap which the index formed in the corona-breakdowns seen this year has been filled now properly as expected therefore it is important currently how the index develops further and if there can come a possible continuation or fall back to lower levels, overall it is important to note that the recovery is not fundamentally backed as the real economy is still damaged by corona and the gains seen are mainly provided by retailers as smart-money is currently still staying out of the market, such perspectives can lead to a speculative market environment which does not mean it can convert to a healthy bullish environment but it means that rallies and new highs should be seen crucial, in this case I detected some important signals meaningful for the next outcomes of the index.
Looking at my chart you can watch there that the index just confirmed recently the gap-fill and now it is possible that supply enters the market firstly providing a correction as such mechanism is seen often after such gap-fills, otherwise it is possible that bulls are strong enough and just move above the gap-fill-level. Currently it is more possible that the index firstly shows a pull-back and consolidation between the higher boundary of the channel and the support/resistance level as seen marked in my chart. Basically there are two possible outcomes given, the first is the bullish breakout scenario with a new high forming which is more likely at the moment as the index has some solid supports as you can watch, the second is that the index firstly visits lower levels to reallocate newly which is the unlikely scenario as the index firstly has to take out the solid support levels before moving on, but as the rally is still not fundamentally backed this scenario should not be ignored at all but when the index holds the support properly it will move on to form this historical new high which will be worthwile and will tell if its just a huge bull-trap or solid rally.
The current situation is a situation where the index has to show if its underlying pace is strong enough to advance in the structure but when considering all this it is important that the real economy also recovers together with the market, till this is not happen all rallies happening are highly speculative and walking into the danger of a possible bearish volatility similarly to those seen this year. When the index takes out the previous high and forms another one it is from high importance to do this sustainable because when it does not and the area is just visit a short time to go back into the established range this can be a fake breakout leading to downside ahead. It will be highly interesting how this is playing out and if the index has the ability to take out the highs substantially. The next times will show how the more likely scenario is playing out and if this can also be backed of a solid real economy which is growing together with the market because this is what is needed till then the market is still in a unconfirmed status and can reverse to the bearish side back again which can be sudden and heavier than before.
In this manner, thank you for watching, support for more market insight and have a good day!
"There are many roads to prosperity, but one must be taken."
Information provided is only educational and should not be used to take action in the markets

RUSSELL 2000, Trading Above Keylevel With Continuation Possible!Hello Traders Investors And Community, welcome to this analysis about one of the major stock market indices RUSSELL 2000, its 4-hour timeframe perspective, the recent price-action, the current formation and what to expect from the index the next times. Similarly to other preliminary indices the RUSSELL 2000 has recovered from its heavy corona breakdown seen this year but this does not mean the bear-market is overall over, in this case, all the main stock market indices begin to struggle with their uptrend growth and either consolidating or already building up downside potential, therefore, it is important to look at the facts and realistically measure what is possible in the next times and what is unlikely to do not get overwhelmed when things move into the reverse perspective, therefore I detected some important signals which will determine the further outcomes of this index.
When looking at my chart now you can watch there that the index formed a symmetrical triangle below the meaningful falling resistance marked in blue which formed by the all-time-high and the tops formed in last price-actions. This triangle has successfully confirmed to the upside and the index managed to closer above the important falling resistance line where it consolidates currently as you can watch it marked in my chart, this consolidation and breakout occurred are two decent bullish signals playing to the possibility that the index can continue with bullish rising to the upside when there do not come any bearish signs which invalidate this scenario again. Furthermore, the trading above the 60-EMA marked in cyan in my chart is supporting this scenario which will be confirmed properly when the index manages to break out of the consolidation and move on as it is shown in my chart.
Taking all these factors into consideration the index currently provides a more bullish than bearish outlook on the short-term, this is really important to note that the index has some potential in the short-term but it will run inevitably into resistance levels higher in the structure, this means a bearish reversal is not totally out of the sight as the uptrend begins to struggle and slowly don't this should not be kept by side. Also, the real economic situation is still providing a big divergence to the stock-market where real economy is damaged by corona and the stock market making almost exceptional growth to the upside where retail moves into the market while smart-money stays out of it this isn't a healthy environment where both factors real economy and stock-market growing together and therefore should not be ignored considering the next months and outcomes where the speculative rallies can reverse and lead to a shaky downside environment.
In this manner, thank you for watching, support for more market insight, have a great day, and all the best to you!
Information provided is only educational and should not be used to take action in the markets.

✅DXY WILL KEEP GROWING|LONG🚀
✅DXY is going up and the
Price broke the key horizontal
Level of 104.310 went up then
Made a pullback and a rebound
So we are bullish biased mid-term
And we will be expecting
Bullish continuation
LONG🚀
✅Like and subscribe to never miss a new idea!✅

S&P500: Formed new bottom. Expecting a rise.The S&P500 index has hit the 0.382 Fibonacci level after a 4H Golden Cross that turned the 4H technical outlook bullish (RSI = 59.782, MACD = 9.210, ADX = 36.280). As mentioned before, this is the same fractal of December 2022 to January 2023. Holding the 0.382 was key to sustaining a rise to the 1.236 Fibonacci extension. We remain bullish on S&P500, targeting the current 1.236 Fibonacci (TP = 4,670).
Prior idea:
## If you like our free content follow our profile to get more daily ideas. ##
## Comments and likes are greatly appreciated. ##

NASDAQ, Trading In A-T-H Conditions, These Are Important Levels!Hello Traders Investors And Community, welcome to this update-analysis where we are looking at the NASDAQ, its 4-hour timeframe perspective, the recent price-action-events, what is important to look at now, and what we can expect from the index further in destiny. The last weeks the NASDAQ recovered from the heavy corona-breakdowns seen this year and is now trading in all-time-high-conditions where a correction when not a bigger pull-back is possible as the index is showing reversal signs in the range, by the way, it is the only index which moved strongly above all-time-high while the other indices trading still below or near this condition, in this case, I detected some meaningful and important signals which will determine the outcome of NASDAQ sustainable.
As you can watch now in my chart and what is really important in this whole environment the NASDAQ currently builds up are the established rising-support-lines which you see marked with the trendlines and the numbers 1,2,3, these are the preliminary trendlines holding the whole uptrend to the upside and therefore important to hold. Furthermore, you can watch that NASDAQ broke the first major trendline to the downside which can indicate a correction to test the next trendline as you can watch it in my chart, from there it is possible to back-up and move on when this is not the case it is overall highly important to hold the third major trendline in the structure because when this does not happen the index will show continuation downside in the bearish zone.
Overall we can take note that the NASDAQ provided some healthy and strong up moves but to hold this it is from high importance that the index shows stabilization in the range and do not falls to lower levels again because when this happens the possibility for a more protracted continuation is given as the S&P and other major market indices still trading below all-time-highs and there are still big differences between real economy which is damaged of the declines seen this year and the stock market where many stocks showing growth the bear market is not from the desk and confirmedly over which can come back again with increased pace, therefore, it is highly important to not lose this scenario out of mind to be prepared when it shows to take appropriate action.
In this manner, thank you for watching, support for more market insight, have a great day, and all the best to you!
The past, like the future, is indefinite and exists only as a spectrum of possibilities.
Information provided is only educational and should not be used to take action in the markets.

DOW JONES, Short-Term-Gap Filled, This Levels Are Important Now!Hello Traders Investors And Community, welcome to this update-analysis where we are looking at 4-hour timeframe of the major stock-market-index DOW JONES, what it is building up the last times, and what we can expect the next times. In a previous analysis, I gave a free signal for the index with the small-term-gap to be filled which now reached its targets fully and properly within the schedule, now this fact does not mean the index is completely bullish and will continue in this manner but it has some meaningful possibilities to do this when it manages to confirm given scenarios, there are some important levels and signals which I found which can affect the outcome substantially.
As you can watch in my chart the index is trading in this important descending channel formation building a coherent upper boundary from its all-time-high to the previous highs established which it is currently testing to the upside, as the gap was filled and some supply entered the market the index is now consolidating between 26500 and 27000 which is overall a good sign that the index still holds this level. Furthermore, it has some decent support between the 26350 and 26500 levels which is marked in orange and building the lower range support below this level the index has also lower range support between 24700 and 24900 where it can bounce given within a solid likelihood.
Now given these results we can come to the conclusion that the index has two possible scenarios to play out before it confirms the upper gap to be filled. The first scenario will play out when the index holds the current level and manages to move above the falling resistance to confirm above it therefore it is from high importance that the index does this with a decisive high volatile move, the other scenario is that the index firstly falls below the support in the range and confirms the overall lower support before it climbs up and sets up to fill the gap. As there is still some solid support in the range of the first scenario, scenario A is more possible within a given possibility of 65 % and scenario B with 35 %.
This technical situation of the index does not alter the whole dynamic of the stock market which is currently trading in a speculative movement where many retailers enter the market while smart-money staying on the side-line. This can go some time but sooner or later the differences between the real economy and stock-market will be to be that either an adaptation of the two factors occurs or a shift into the bearish perspective again which can increase to the downside as there are many retailers in the market since the corona-breakdowns seen this year. The bullish short-to-middle-term perspective does not alter this fact therefore it should definitely not be kept aside, it will be highly interesting how this dynamic will develop.
In this manner, thank you for watching, support for more market insight, have a great day, and all the best to you!
Even though fortune's destiny seems obscure in the present, it is actually beginning right now.
Information provided is only educational and should not be used to take action in the markets.

SPX500-Index-Market-Status-UpdateHello Traders Investors And Community, welcome to this update-analysis about events since the last one, the current structural elements added to the environment, and what we can expect or nor expect from the SPX500 index. As mentioned in the previous forecast the index was and is trading in an important uptrend-channel which holding the whole bull-market construct to the upside since the corona-breakdown-lows seen this year, if you did not already see this analysis I highly recommend it to you when going on my account to have a full-depth-overview. As there increased the bearish pressure the last weeks due to new corona-fears and ongoing difficulties in certain fields which resulted in a swift down move with a gap developed and a piercing of the lower boundary the situation has altered to a shaky index right now, in this territory, we need to keep the possible scenarios coming upon us in mind to act accordingly when they happen and do not forget the still not recovered real economy.
As you can examine now when looking at my chart is that the index pierced the lower line of the channel to the downside which can certainly be a bull-trap before moving higher but the volatility with which this breakdown happened should not be ignored also the gap which provided during this speedy bearish breakdown was more bearish than bullish. This case shows one more time how events can affect the price in a fast and undetermined manner. For now, the index has found some support at the 30-EMA you can see marked in orange within my chart and now setting up to possibly fill the gap which confirmed downside when this gap-fill play out now we need to keep in mind that after such a mechanism the supply in the market can increase again as there are still sellers in the level who want to sell at certain prices.
Now when this overall scenario takes places it is from high importance for the index to hold the uptrend-channel to establish a solid base of support here because when this does not play out we will get bearish pressure to the downside for sure when confirming below. This will move the index to test remaining lower levels which will be the 100- and 500-EMA you can watch marked in green and black in my chart, in this case, the 500-EMA is extremely meaningful to establish support otherwise the index has a huge critical bearish zone below the EMA that is marked in red within my chart when the index confirms below that level it will increase bearishness to the downside and lower levels will be marked. On the other term when the index stays within the uptrend-channel it has to confirm above the established 3230 high to move higher and test the remaining all-time-high levels.
When comparing the technical situation with the fundamental real economic situation we can take note that the rally seen since the corona-lows this year was mostly driven by fresh money pumped into the market and was a recovery of the heavy breakdowns established this year which is a normal mechanism but the fact that the real economy does not grow together with the stock-market and is still damaged from the events happened makes the rally a more unhealthy environment because the real economy and stock-market should move together, therefore when considering the next weeks to come and a possible bullish continuation it is from high importance that the real economy grows together with the stock-market otherwise this bullish rally which will establish would be a speculative money-driven bull-market with no underlying fundamental base of growth, such a speculative rally can lead to more difficulties in the aftermath where bearish pressure can increase again, therefore, the rally should be seen with an critical eye to be on the track in case of possible upcoming volatility.
In that manner, thanks for watching, support for more market insights, and good day my friends.
Prospect is the ingredient of good fortune.
Information provided is only educational and should not be used to take action in the markets.

GOLD: Will Keep Falling! Here is Why:
The recent price action on the GOLD pair was keeping me on the fence, however, my bias is slowly but surely changing into the bearish one and I think we will see the price go down.
❤️ Please, support our work with like & comment! ❤️


Analysis of BANKNIFTY index on Daily chart (1D)Looks beautiful on the daily chart... I'm happy to see the breakout candle of the H&S pattern trendline (pink line)... Now, we can see the higher resistance shifted to 45300 / 45900 and support is shifted to 44500 / 44100
It's just a view of what I observed on the chart. I'm sharing my observation on this platform purely for education purposes and It's not a trading idea. I'm not a SEBI registered technical analyst, so consult your financial advisor before trade and trade based on your own knowledge and risk management...

BTCUSD: Bulls Will Push
It is essential that we apply multitimeframe technical analysis and there is no better example of why that is the case than the current BTCUSD chart which, if analyzed properly, clearly points in the upward direction.
❤️ Please, support our work with like & comment! ❤️

Will the #Dollar Index Rally Continue?Monday, September 10, 2023
In the weekly chart of the US #Dollar Index, the market structure appears #bullish. Recently, the market found support around the 104 level, and the Dollar #Index has reached the 38.2% Fibonacci retracement level as part of a corrective move.
In this week's trading, if the current #uptrend continues, and the 38.2% resistance level at 105.45 is #broken, the market may find a clear path towards the 50% Fibonacci #retracement at the 107 level.
However, if the #resistance zone at 105.45 holds its ground, the #upward #momentum in the market may be limited, and the Dollar Index could return to the 104 #support level, marking a 23.6% #Fibonacci #retracement #correction.
So based on this analysis I suggests a bullish outlook for the Dollar Index.
