VIX Support Cluster Ahead! Buy!
Hello,Traders!
VIX is headed to retest
The support cluster of the
Falling and horizontal
Support levels at around
14.32 from where I would
Be expecting a bullish rebound
Buy!
Like, comment and subscribe to help us grow!
Check out other forecasts below too!
Index

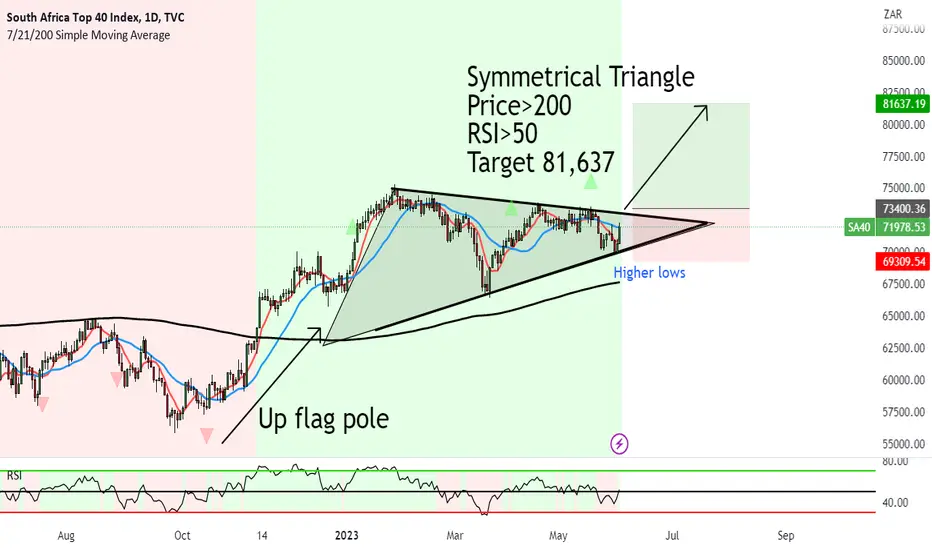
JSE ALSI 40 Symmetrical Triangle wait for break up to 81,637Symmetrical Triangle seems to be forming on the JSE ALSI 40.
This is where price constricts into a triangle that is not facing up or down.
We now need the price to break above the Apex, which will send the price higher.
The beauty about Symmetrical Triangles, is that they are generally continuation patterns to the prior trend.
With the up flag pole before the triangle confirmed, means we will expect a break up.
Price>200
RSI>50
Target 81,637
Nifty Approaching SupportLast 3 days nifty is giving lower high . Today nifty was not able to break yesterdays high for last 2hrs. This is making weaker. Hold short till yesterday's high is broken and Sq up short at 18342.View for short nifty is achieved. We will have to wait for next view till Monday.

GER40 DAXNice zone for sell in my opinion.
We should go down before, check my last analysis, but some institution changed narration, anomaly:)))
regards if you read that

Nikkei (NKD) Looking to Complete Wave 5 of Elliott Wave ImpulseShort term Elliott Wave in Nikkei (NKD) suggests that cycle from 1.3.2023 low is progressing as a 5 waves Elliott Wave impulse. Up from 1.3.2023 low, wave 1 ended at 28715 and pullback in wave 2 ended at 26285. Wave 3 rally ended at 31695 as 1 hour chart below shows. Dips in wave 4 unfolded as a double three Elliott Wave structure. Down from wave 3, wave (a) ended at 31180 and rally in wave (b) ended at 31405. Wave (c) lower ended at 31075 and this ended wave ((w)). Rally in wave ((x)) completed at 31450. Index resumed lower again in wave ((y)) with internal subdivision as a double three in lesser degree.
Down from wave ((x)), wave (w) ended at 30940 and rally in wave (x) ended at 31155. Decline in wave (y) ended at 30634 which completed wave ((y)) of 4. Index has since turned higher in wave 5. Up from wave 4, wave (i) ended at 31200 and pullback in wave (ii) ended at 30945. Index rallies again in wave (iii) towards 31345 and pullback in wave (iv) ended at 31185. Expect Index to extend higher to end wave (v) of ((i)). Afterwards, it should pullback in wave ((ii)) to correct cycle from 5.31.2023 low in 3, 7, or 11 swing before the rally resumes. Near term, as far as pivot at 30634 low stays intact, expect pullback to find support in 3, 7, 11 swing for further upside.

DOW TAKING SUPPORT.From last three-day Dow is taking support of red trend line. Dow is trading with 500 point range. After big move on Monday Dow is consolidating for last three days. It is tendency of index/stock that after big move it consolidate, trading range become narrow and then burst. Up or Down. Todays chart is self explained. 26th and 30th May top is around 33200 and low is 32586 on 25th 32709 today. If todays low is not broken then this is beginning of higher low pattern.
1 SL was lowered to 32700 yesterday which Dow had respected.
2 At Begening of lower high, risk redward ratio is favorable , long can be initiated with 32700 SL. If trade goes in favorable trailing sL of 100 pts can be maintained. If SL triggered reverse trade can be favorable.

Elliott Wave View: DAX Pullback in ProgressShort term Elliott Wave View in DAX shows that the Index ended wave (3) at 16333.28. It is now pulling back in wave (4). Internal subdivision of the pullback is unfolding as a zigzag Elliott Wave structure. Down from wave (3), wave ((i)) ended at 16179.14 and rally in wave ((ii)) ended at 16224.32. Index then resumes lower in wave ((iii)) towards 15802.86 and rally in wave ((iv)) ended at 15872.60. Final leg wave ((v)) ended at 15726.5 which completed wave A.
Index then did a corrective wave B rally which unfolded as another zigzag in lesser degree. Up from wave A, wave ((a)) ended at 15860.37 and pullback in wave ((b)) ended at 15726.74. Index then rallied higher in wave ((c)) towards 16079.73. This completed wave B. Index then resumes lower in wave C with internal subdivision as 5 waves. Down from wave B, wave ((i)) ended at 15925.22 and wave ((ii)) rally ended at 16058.43. Expect Index to extend lower within wave ((iii)), then rally in wave ((iv)) followed by another leg lower in wave ((v)). This should complete wave C and (4). Potential target lower is 100% – 161.8% Fibonacci extension of wave A which comes at 15103.6 – 15476.8. Near term, as far as pivot at 16333.28 high stays intact, expect rally to fail in 3, 7, or 11 swing for further downside.

GER40 possible LongIt looks like Ger40 might be forming an inverted Head & Shoulders pattern on the weekly chart, which could potentially indicate a rise in price.
The resistance Trendline was recently broken and retested, and we're now waiting for the neckline to be broken to gain momentum towards the upside.
It's important to keep in mind that we'll want to see the candle close above the neckline for confirmation.
To avoid any potential losses, it's best to wait until the candles have closed before making any moves.
Additionally, there's a small gap to fill between $420 and $421 that could be worth keeping an eye on.

US500: Expecting Bullish Movement! Here is Why:
The charts are full of distraction, disturbance and are a graveyard of fear and greed which shall not cloud our judgement on the current state of affairs in the US500 pair price action which suggests a high likelihood of a coming move down.
❤️ Please, support our work with like & comment! ❤️

SELL TRADE SETUP ON S&P 500Hey Traders,
Check this analysis out on S&P 500.
The pair is at the last phase of the ascending wedge pattern and a nice fall from grace could be well anticipated for.
Keep a close tab on it

DOW ; WAIT AND WATCH In continuation uation to yesterdays analysis, from todays candle stick formation we observe
1 Dow is trading below new emerging uptrend line (green).
2. Dow is trading near red downtrend line which is now support line.
3. Till Dow is not trading below red line we cannot conclude false breakout.
4. Till now low of 24 and 26th May is not given up (32750), which is our SL.
5. MacD is in sale zone , if it continue to go below today's level then there is problem. Dow may not hold support.
6. Dow is again at 0.500 Fibonacci retracement level.
Yesterday given, risk trader could go long with SL 32750. Dow is near 32750. If for 30 min it doesn't recover and remain below 32750 then this k SL is triggered.
Conclusion
WAIT AND WATCH TILL 32750 AND 33100 levels.
Trade confirmation sell below shooting star pattern. Long above 33200

DOW : WAIT & WATCH STRATEGY.After confirmation of shooting star pattern, Dow is in consolidation phase as it has not broken yesterday high. Long position was suggested above yesterday high, which not yet trigger. Currently Dow is trading just above red downtrend line. New uptrend line (green lines ) is emerging . Risk reward ratio is favorable for long positions . SL is if Dow break below green support lines crossing red downtrend line. MacD is below 0 line and signal line, but at this point MacD is not to be considered as it is laggard indicator. Risk traders can initiate long with strict stop, other wise its better to wait till Fed and Debt ceilings decession. Confirmation of trade is long above yesterday high ans short below shooting star candle pattern.

SPX500USD: Short Trading Opportunity
SPX500USD
- Classic bearish setup
- Our team expects bearish continuation
SUGGESTED TRADE:
Swing Trade
Sell SPX500USD
Entry Level - 4212.9
Stop Loss - 4232.0
Take Profit - 4184.1
Our Risk - 1%
❤️ Please, support our work with like & comment! ❤️

dollar index lift-off to nov 22 price areasdemand level of proximal price @ 101.500 is in control of price , targets levels at nov 22 price areas at supply level of proximal price @ 112.000
supply and demand in combination with price action!
put together by : pako phutietsile, @currencynerd

SPY S&P 500 Index ETF and the Debt Ceiling DealThe political climate is favorable for a small rally of SPY, the S&P 500 Index ETF, towards the next resistance level of $430.
After several weeks of tense negotiations, President Joe Biden and House Republicans have reached an agreement in principle to address the debt limit and cap spending. The debt-ceiling deal is now finalized, and here are significant parts of the agreement:
First, the agreement suspends our $31 Trillion debt ceiling until January 2025, providing some relief and avoiding immediate concerns.
Additionally, the agreement ends the pause on student loan repayments, allowing borrowers to resume their payments. This decision aims to ensure the stability of the student loan system and address the long-term financial implications.
Furthermore, the agreement includes stricter work requirements for low-income and older Americans who receive food stamps. These requirements are intended to encourage self-sufficiency and help ensure that federal aid benefits are effectively utilized.
Regarding IRS funding, the agreement entails a $20 billion reduction from the initially proposed $80 billion budget. This reduction specifically targets the allocation meant to crack down on tax evasion by wealthy individuals and corporations.
Moreover, the deal puts an end to the ongoing freeze on monthly student loan payments and interest. It also introduces restrictions on the President's ability to reintroduce such a freeze in the future.
To avoid contentious debates until after the next presidential election, the agreement suspends the debt limit until January 2025. This decision provides a temporary relief from potential conflicts surrounding the debt limit.
The agreement also implements new work conditions for Supplemental Nutrition Assistance Program (SNAP) recipients, raising the age limit for work requirements to 54. This measure aims to promote workforce participation and enhance the effectiveness of federal aid programs.
Overall, this comprehensive agreement addresses various aspects of the debt limit and spending caps, aiming to strike a balance between fiscal responsibility and supporting those in need.
My overall outlook is still bearish and i think the small rally could easily turn into a bull trap.
Looking forward to read your opinion about it.

DXY: Bullish Continuation is Expected! Here is Why:
The recent price action on the DXY pair was keeping me on the fence, however, my bias is slowly but surely changing into the bullish one and I think we will see the price go up.
❤️ Please, support our work with like & comment! ❤️

BANK NIFTY ANALYSIS - 29/05/2023BUY ABOVE - 44080
SL - 43960
TARGETS - 44150,44250,44400
SELL BELOW - 43960
SL - 44080
TARGETS - 43890,43680,43530
Trade Safe & Happy Trading Guys
This is only for educational purpose so TAKE YOUR OWN RISK REWARD

NIFTY ANALYSIS - 29/05/2023BUY ABOVE - 18510
SL - 18480
TARGETS - 18540,18570,18610
SELL BELOW - 18480
SL - 18510
TARGETS - 18460,18420,18380
Trade Safe & Happy Trading Guys
This is only for educational purpose so TAKE YOUR OWN RISK REWARD

US30: Short Trade with Entry/SL/TP
US30
- Classic bearish setup
- Our team expects bearish continuation
SUGGESTED TRADE:
Swing Trade
Sell US30
Entry - 33111
Sl - 33380
Tp - 32706
Our Risk - 1%
❤️ Please, support our work with like & comment! ❤️

US500: Bullish Continuation
The analysis of the US500 chart clearly shows us that the pair is finally about to go up due to the rising pressure from the buyers.
❤️ Please, support our work with like & comment! ❤️

Nifty Weekly Analysis Nifty had retraced 0.618 level of 15100 to 18900 move at 16800 from last June till 13 March. On weekly chart nifty is making higher high and higher low for last 10 week. ( green line). Since 13 is a fibonacci no nifty is expected to make new high and low for 3 more weeks. ( it is based on Fibonacci levels not necessary). MacD is just above signal line and just above 0 line which states beginning of up trend. ( As weekly chart is better for long term view). Any move above 18900 19000 nifty can reach first fibonacci extention level at 1.272 ie 19900. From here SL is to be strictly followed below green uptrend line or close below lower high of previous week.
Long can be entered above 18550 with first target 18900 , 19300, 19500 and 19900. This analysis is for next 1 month.

DOW:- WAIT AND WATCH STRATEGYDow opened at 32787 gave low of 32700. After an hour Dow broke yesterdays high and with no no time next candle stick made high of 33028. Yester day after making low of 32575 Dow recovered forming shooting star pattern, which is formed because of buyers emerging at lower lever an pushing index up. Today is follow up buying day. If Dow closes with green long candle.stick, It can be taken as reversal pattern and can go long after consolidation or above today's high. Yesterday suggested SL above red line. From last 1 hrs Dow is trading above red downtrend line. This is to be taken as bullish. Since yesterday low is 400 points along position must be closed below 50% of yesterday high and low ie 32750. But it suggested to go long after today's confirmation.

US100:Long Signal Explained
US100
- Classic bullish setup
- Our team expects retracement
SUGGESTED TRADE:
Swing Trade
Buy US100
Entry - 14241.9
Stop - 14029.8
Take - 14558.5
Our Risk - 1%
❤️ Please, support our work with like & comment! ❤️
