S&P 500 Index V-Shaped Recovery!Hello Fam!
S&P 500 fully recovered after February crash, we have a V-Shaped recovery, so if horizontal surpassed, we will get a new uptrend
Good luck to you!
Please consider to put a like to my idea for supporting me & subscribe for more ideas.
Idea is not the financial advice!
Indexes

DXY - Dollar was Oversold, Now Recovering! Hello Fam!
Falling wedge pattern is crossed upward, oversold signal confirmed. You should look at the dollar strengthening, when market opens
Good luck to you!
Please consider to put a like to my idea for supporting me & subscribe for more ideas.
Idea is not the financial advice!

Say HELLO to INFLATION
How to measure inflation?
though we normally apply CPI reports for measuring that,
it looks like this data is no more relevant.
I was a bit surprised by the nature of the sharp growth in different markets from March:
cryptocurrencies, stocks, metals, commodities .
while many countries are STILL in lockdown and many people just went bankrupt during these hard times,
everything indicates that things are better than ever.
reading different news outlets, everyone states the RECOVERY and strength of the modern economy.
it's marvelous strength that helped to overcome the severe crisis.
as everything keeps falling apart, I started to look for other reasons for this exponential growth.
it turned out that all these bullish rallies have started almost at the same time.
some BILL was accepted and signed in March, triggering a fall of greenback and market pumping.
looks like we are not contemplating the times of USD inflation .
it is severely painful for me because I am a cash guy and hold my saving in dollars.
but it turned out to be a very bad idea...
what is the solution?
spend money. take it from your mattress and start spending.
deposits are not the option.
only assets will keep their value.

us100Hello traders, here is the analysis from our team :
buy limit: 11178
target : 11198
stop : 11158
Let us know in the comment section below if you have any questions.😉

S&P500 Index (SPY) More Growth!!!
it looks like spy is going to set a new higher higher higher close soon.
the price has recently broken above the resistance line of the ascending triangle formation.
the breakout is considered to be confirmed now.
next goal for buyers is 3413 level.
it is based on a long wick of 6th August candle.
because the market is trading on daily highs, I would suggest risking no more than 0.5% of your deposit.
good luck!

SP-500 Index Elliott Wave Analysis For 2020Find out more about the whole truth, nothing but the truth and the whole truth
about what the Elliott wave principle has in store for the SP-500 stock index;
and how NASDAQ 100 index is the one everyone is watching carefully right
now.
Know more today.

DAX Index AnalysisDAX index is often following in the footsteps of the Dow Jones index.
The chart shows my previous analysis. Those analysis still stand
today. One that is trading the DAX index must always keep an eye
on the Dow Jones Index. I hope this will help.
Best regards

Nasdaq heading downI'm seeing a fall of Nasdaq happening, maybe he can fall back to 10500 maybe more if the breaks continue

Dow Jones Industrial Average (US30) Money Printing Scenario
US indexes keep growing.
probably they haven't heard about the massive unemployment rate and corona aftermath all over the world.
nothing can stop the global economy.
who dares massive gbp loss this year,
who dares the spike in bad debts.
if you noticed a salary decrease during the last few months, probably you just don't know how to count.
it looks like things are better than ever so we keep being bullish biased.
27550 resistance will be reached soon.
in case of a bullish violation of that the market will keep growing.
the next stops will be:
28290
2925

DXY - Correction?We could be seeing a correction for DXY leading to the descending timeline where we'll either see a break or bounce

4 VS 1 / DJI, SPX, IXIC y RUT Versus TLT (BONDS 20 YRS)
Cuando las acciones suben, los bonos deberían bajar. Es simple porque los bonos son como una inversión poco rentable pero segura en tiempos difíciles. Pero cuando comparamos 4 índices con un ETF para bonos a largo plazo, me viene a la mente que en el futuro, la mayoría de los inversores están apostando al mercado a colapsar, (no ahora). Podemos ver la línea de convergencia (por ahora) entre ETF "TLT" (BONOS 20 AÑOS) y 4 índices importantes de USA.
Obviamente, si vemos la imagen macro de "US 10 Y", descartamos cualquier riesgo en el corto plazo.
----------------------------------
As we know about opposite, when stocks go higher, Bonds should Go Down. It is simple because Bonds are like a low profitable but safe investment in hard times. But when we compare 4 indexes against an ETF for Long period bonds, it comes to my mind that in a future mostly investors are betting market to crash, (not now). We can see the convergence line (for now) between ETF "TLT" (20 YEARS BONDS) and 4 important indexes of USA.
Obviously, if we see the macro Picture of "US 10 Y" we are very solid at this time and we discard any risk.


Indexes vs M1 & M2 Money SupplyM1 = coins and currency in circulation + checkable (demand) deposit + traveler’s checks.
M2 = M1 + savings deposits + money market funds + certificates of deposit + other time deposits.
We are looking at the major US Indexes Dow 30, SPX 500, Nasdaq 100, & Russell 2000 vs each of these types of money supplies
As we print more we expect these money supplies to increase, so we can start to see the 'real growth' in terms of how much $ is 'out there'
In the more liquid M1 Money supply it looks like we may have bottomed here on the indexes by testing the 'all time' trend line
But in the less liquid M2 Money supply we /could/ expect a fall further if things really go south here. We never tested the 'all time' trend line. No /need/ to but if we did it would be within reason.
I examine lots of these 'composite' charts as I call them, but let me know your thoughts as well!
Manage your own risk
Much Love
GL HF
xoxo
snoop

We are in an unprecedented fiscal experimentEconomic downturns are usually accompanied (and perhaps prolonged) by a tightening of private credit, as you can see on this chart of S&P 500 performance vs commercial and industrial loans from all commercial banks. Lending significantly lags stock market performance, but a downturn in lending generally confirms a recession, and an upturn in lending generally confirms a new bull market.
This time, however, is different-- at least in terms of the initial response. The rapid downturn in stocks was met with a huge spike in new private lending, encouraged by massive Fed liquidity, and the recovery of stocks was as sharp as the initial selloff. Now, however, lending has turned back downward, and it's possible that over the next year we could see the same tightening of credit that usually accompanies a recession. The Fed can increase bank reserves, but it can't increase borrowers' collateral or their appetite for risk in a difficult economic environment.
Does this downturn in private lending, like the previous ones, confirm that we're in a recession and that stocks will slide from here? Will the next upturn in private lending signal that we're back in a bull market? Only time will tell, but the results of this experiment will have huge ramifications for both policymakers and investors for decades to come.
Hat tip to @TayFx for help constructing this chart. Also check out his cool charts of SPX vs. M2 money supply and Fed balance sheet:

DOLLAR INDEX (DXY) Update & Important Decision Ahead!!!
DXY is retesting summer's structure low.
the price is currently consolidating within a narrow horizontal decision range.
because the current trend is bearish, I am bearish biased on greenback.
in case of a violation of the range to the downside, bearish rally will most likely continue.
next goals will be:
95.4 - daily resistance
94.8 - year's low
in case of a bullish violation of the range, USD may start recovering.
96.9 will be the first goal.
for now it is hard to predict with high accuracy the next usd move, so let the market decide first and then just act accordingly.

VOLKSWAGEN AG (VWAGY) Bullish Breakout & Continuation
VWAGY broke and closed above the important decision range on 4H.
the market has retested the range and showed a posilitive bullish reaction to that.
now bullish rally is expected.
next goal:
18.0

S&P 500 sell signals on D1.S&P 500 (SPX), daily timeframe: Resistance zone + Dragonfly doji + Side of Bollinger bands + Divergence

S&P500 Index (SPY) Accumulation & Bullish Continuation
hey guys,
it looks like spy is preparing for a bullish continuation.
with a sequence of higher lows on a daily and weakening bearish retracements,
the price is one more time testing 3230 horizontal resistance.
being broken to the upside (daily candle close above) it will trigger a buying reaction and the market will start growing further.
next goals will be based on this winter's highs:
3325
3385

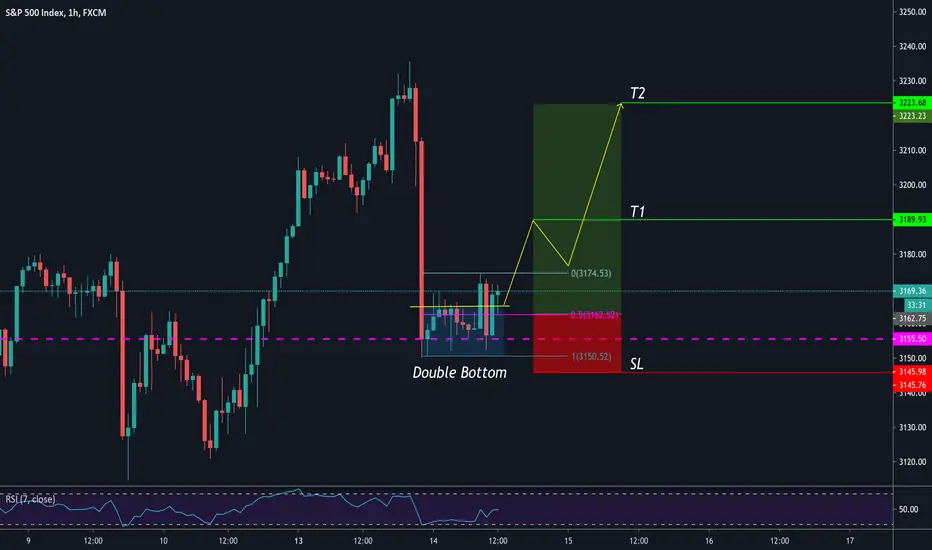
S&P500 Index (SPY) Key Level & Bullish Continuation
SPY is retesting a key daily/4H structure.
the price has formed a double bottom formation on that on 1H.
I expect a bullish continuation.
target levels:
3190
3220
US 30 USD SELL (US WALL STREET 30 INDEX - US DOLLAR)Hi there. Price is moving impulsively to the downside. Wait for the price to complete the continuation pattern that is forming on lower time frame and watch strong price action for sell.

SPX500 USD SELL ( STANDARD AND POOR'S 500 INDEX - US DOLLAR)Hi there. Price is moving impulsively to the downside. Wait for the price to form a continuation pattern on a lower time frame and watch strong price action for sell.

S&P 500 Index Full Analysis (Still Bearish Here)I would like to give a full analysis of the S&P 500 Index (SPX) chart... Let's get started!
We will look at my classic signals and then a general view.
The classic bearish signals coming out of this SPX chart are as follow:
The first thing to notice here is a lower high compared to the 8-Jun.
I shared a chart on this date mentioning that the S&P 500 Index had peaked.
The next thing we have is a test/challenge of EMA10 as support (meaning, from up to down).
Since we have a lower high, the test of EMA10 signals lower prices.
We follow with a bearish cross on the MACD.
The RSI remains above 50 but trending lower, while the STOCH is showing a strong curve pointing down.
We also had a rising wedge pattern, another classic, which broke already a few weeks back.
The trading volume is going lower. Notice that the green volume was lower than previous days/weeks on the latest bounce that produced a lower high.
General view (SPX Bearish)
Don't get caught up in the noise, the hype, the news or \whatnot... Just look at the chart.
I haven't read a piece of news about the SPX basically ever, for Bitcoin or anything else for a long while, yet, I can continue to read the charts are produce a high accuracy rate... Everything is here... Everything is on the chart.
Keeping it simple... Trading below the "LAST PEAK" is bearish.
If prices move and close below the "LAST PEAK", it opens the door for additional bullish action but still, there are many factors that keep the bearish view present since the All-Time High is still intact.
So, we can see prices moving above the LAST PEAK which gives us a more bullish view but still remain cautious until the last high is taken out.
As for the initial analysis... We are bearish based on all the signals we just shared above.
What is your take my dear reader/follower/supporter?
Thanks a lot for your amazing and continued support.
Namaste.

BMW: Bearish Continuation & Short Trade
BMW has violated a rising parallel channel.
after that the price set a horizontal decision range and yesterday it was broken as well.
during today's trading session the price retested the 618 retracement of the last bearish leg,
showing a negative bearish reaction.
now bearish continuation is expected.
target levels:
57.15
56.0
