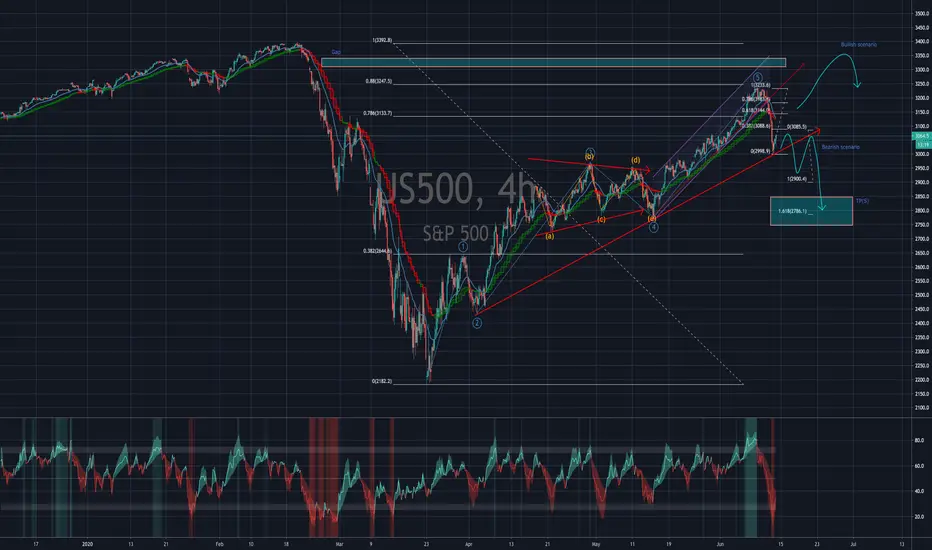
US500 Updated - The Next WeekI speculate here on formation of EW triangle and repetition of previous fractal. RSI 4H and 1D is getting downwards momentum though, so we might see a pull-back as far as to .786 to form a trend-line of the 1st degree - but at least .382 is expected before continuing up.
Indexes
S&P500 Index (SPY) Multi Time Frame Analysis & Price Action
SPY technical analysis and trading plan for next week.
Please, support this video with like and comment!
Thank you:)

SPX - All eyes on 3125 Pivot To End The Week Bearish below 3120 into 3110/3000
Bullish Above 3130 into 3140/3150
Quarter theory + Market structure

LUKOIL (LKOH) Perfect Example of Accumulation
Lukoil is trading in a bullish trend.
for more than 1 month the price is consolidating within a wide horizontal trading range.
based on the preceding price action our bias is bullish here and we are waiting for a bullish violation of the range.
daily breakout will trigger a buying reaction and the price will most likely keep growing.
next goal will be 5800!

CATERPILLAR (CAT) Flag Breakout & Bullish Continuation
hey guys,
on a mid-term perspective caterpillar is trading in a bullish trend.
at the beginning of June, the correction started and for the last two weeks the price was steadily going down within a falling channel
but NOW it looks like the market is returning to a trend.
the price broke above a resistance line of a bullish flag formation.
the breakout is considered to be confirmed and we now can expect a further bullish continuation.
target levels:
128.8
131.5

Gap Fill Fake out before crashConsidering how bullish the market has been one more fake out to the upside is a possibility. Momentum has definitely shifted but I can see a small move to the upside due to many short positions shorting the trend line and maybe getting squeezed and the gap up.Not all gaps get filled but a fair amount of them do.

PROCTER & GAMBLE (PG) May Keep Growing
PG showed a positive reaction to a 116.0 daily/4h structure support.
the price formed a double bottom with higher low on 1H and yesterday it broke above a minor horizontal resistance.
it looks like the stock will keep growing.
the best strategy for us is to wait for a retest of the broken resistance to buy.
initial goal - 119.0

S&P500 Index (SPY) Bearish Forecast
hey guys,
short trade went active this night on spy.
reason:
the price reached a strong resistance on 4H,
broke a channel to the downside and formed a double top formation on 1H
I entered the market on retest with sell limit.
now bearish continuation is expected.
target level:
3094

BP PLC: Catching Bullish Continuation
BP is stuck on a key daily/4h structure resistance.
with a sequence of higher lows and formation of the ascending triangle formation, it looks like buying volumes are accumulating for a breakout.
wait for 4H candle close above the underlined area.
then buy aggressively or on pullback aiming at:
334.0
343.0

DAX Index: How to Sell Wisely???
Dax index set a lower high today on 4H.
now the price on its way to 12160 - 12200 support cluster.
let's see the reaction of the market to that level.
bearish breakout (4H candle close below) of support will be a perfect trigger for us to short the market.
you can sell aggressively or on retest.
Target levels:
11914
11623
Stop:
12450
(if the market sets a new lower high again, you can adjust your stop to it)
in case of a bullish breakout of 12430, setup will be invalid.

RYANAIR (RYA) Key Level & Bullish Forecast
hey guys,
looks like ryanair has respected a recent key support level.
the price has formed an inverted h&s pattern on that and successfully broken and closed above its neckline.
now the price will most likely keep growing.
target levels:
12.2
13.0

One more leg up to finish the correction on US500?I follow here a formation of (abc) correction, whereas we've just finished wave (b) and are heading for wave (c).

S&P500 Index (SPY) Preparing To The Next MOVE
Top-down and structure analysis.
Price action and potential scenarios explained.


DOLLAR INDEX (DXY) Will it RECOVER???
hey guys,
after a strong rejection from 3 days key support level dollar leaves clear reversal clues.
the price stopped setting new lower lows on 4H and currently is on its way to test local structure high - the last resort for bears.
being broken to the upside, the market will set new higher high higher close and local bullish trend,
giving us hope for greenback strengthening.
also note that all USD majors pairs stopped bullish rally and currently leaves reversal clues as well.
be prepared for a change.

MCDONALDS (MCD) Bullish Continuation Trade
hey guys,
MCD is retesting a key 3 days/daily level.
on 1H the price has formed an inverted h&s pattern on that and just recently the neckline was broken with retest.
now the price will keep growing to retest the current local structure high.
T1 - 196.0
T2 - 202.0
Stop - 186.85

A wild US500 scenarioI speculate here on a formation of a EW triangle (also know as a bullish flag), whereas as see a formation of wave (a).

NASDAQ (NAS100USD) Breakout of Major Channel & Bearish Outlook
hey guys,
NASDAQ has violated a support line of a major rising channel on 4H.
now the price retests the broken line and it will most likely trigger a strong selling reaction.
goals for sellers:
9350
9182
note that the structure high of February is now above and it serves as a key horizontal resistance.
it adds additional confidence in this forecast.


PEPSICO (PEP) Important Structure Breakout
PEP broke below horizontal daily support.
now the market retesting the broken level and for us, it is a perfect opportunity to catch a bearish movement.
target level: 124.5


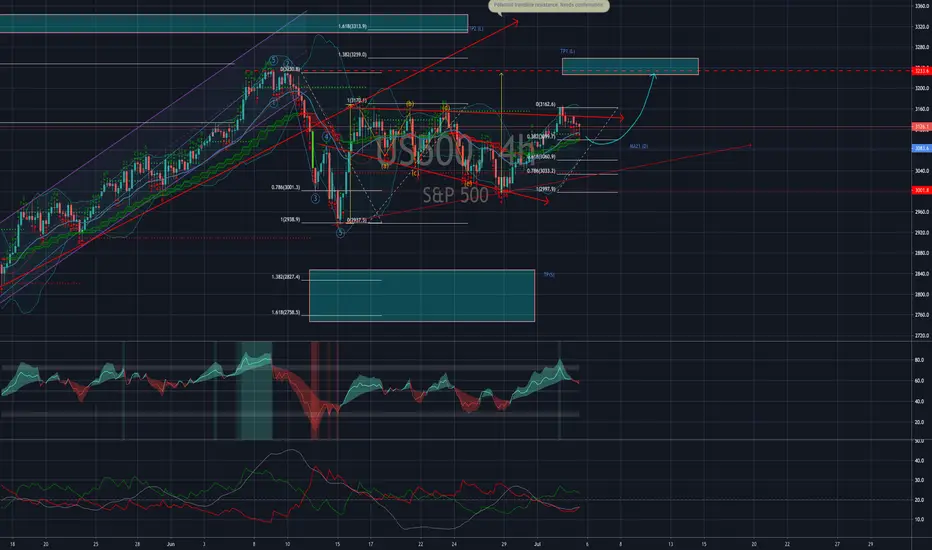
SP500 another TPsWe reached TP1 as due to previous analysis and now will see which other direction will SPX take.