US–Iran Conflict Triggers a Potential Nasdaq Bearish Setup🟣 Geopolitical Flashpoint Meets Technical Confluence
The U.S. weekend airstrike on Iranian nuclear facilities has reignited geopolitical instability across the Middle East. While broader markets often absorb news cycles quickly, high-beta assets like Nasdaq futures (NQ) tend to react more dramatically—especially when uncertainty meets existing technical vulnerability.
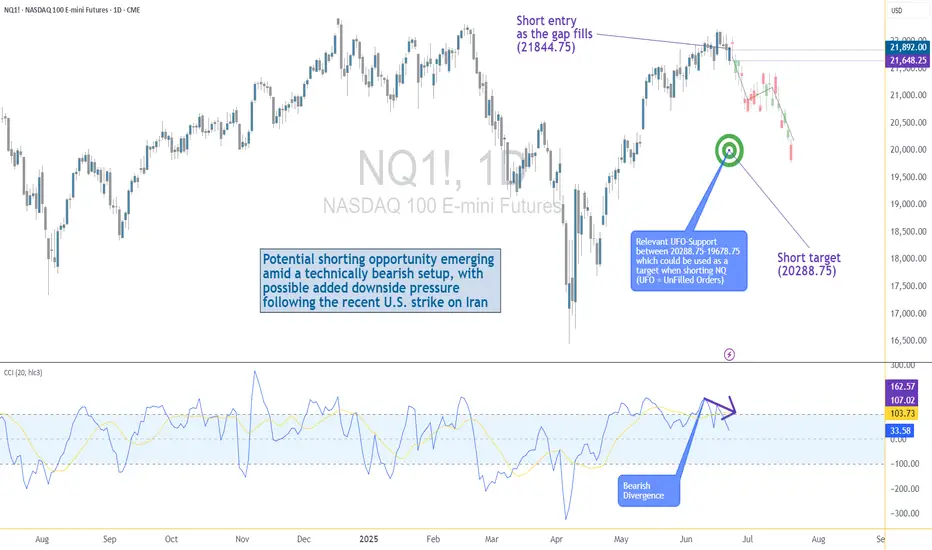
Monday’s session opened with a notable gap to the downside, reflecting immediate risk-off sentiment among futures traders. While the initial drop is being retraced intraday, historical patterns suggest that such gap-fills can often serve as ideal shorting zones—particularly when other bearish signals confirm the narrative. The backdrop is clear: this is no ordinary Monday open.
🟣 Bearish Divergence on CCI Builds the Case
From a technical standpoint, the setup gains weight through a clear bearish divergence on the Commodity Channel Index (CCI) using a 20-period setting. While prices recently pushed higher, momentum failed to follow—an early indication that buyers may be running out of steam. This divergence appears just as price approaches the origin of Friday’s gap, a level that frequently acts as a resistance magnet in such contexts. This confluence of weakening momentum and overhead supply aligns perfectly with the geopolitical catalyst, offering traders a compelling argument for a potential reversal in the short term.
🟣 Gap Origin: The Line in the Sand
The origin of the gap sits at 21844.75, a price level now acting as potential resistance. As the market attempts to climb back toward this zone, the likelihood of encountering institutional selling pressure increases. Gap origins often represent unfinished business—zones where prior bullish control was suddenly interrupted. In this case, the added layer of global tension only strengthens the conviction that sellers may look to reassert dominance here. If price action stalls or rejects at this zone, it could become the pivot point for a swift move lower, especially with bearish momentum already flashing caution signals.
🟣 Trade Plan and Reward-to-Risk Breakdown
A potential short trade could be structured using 21844.75 as the entry point—precisely at the gap origin. A conservative stop placement would rest just above the most recent swing high at 22222.00, offering protection against a temporary squeeze. The downside target aligns with a prior UFO support area near 20288.75, where demand previously showed presence. This sets up a risk of 377.25 points versus a potential reward of 1556.00 points, resulting in a reward-to-risk ratio of 4.12:1. For traders seeking asymmetrical opportunity, this ratio stands out as a strong incentive to engage with discipline.
🟣 Futures Specs: Know What You’re Trading
Traders should be aware of contract specifics before engaging. The E-mini Nasdaq-100 Futures (NQ) represent $20 per point, with a minimum tick of 0.25 worth $5.00. Typical margin requirements hover around $31,000, depending on the broker.
For smaller accounts, the Micro Nasdaq-100 Futures (MNQ) offer 1/10th the exposure. Each point is worth $2, with a $0.50 tick value and much lower margins near $3,100.
🟣 Discipline First: Why Risk Management Matters
Volatility driven by geopolitical events can deliver fast gains—but just as easily, fast losses. That’s why stop-loss orders are non-negotiable. Without one, traders expose themselves to unlimited downside, especially in leveraged instruments like futures. Equally critical is the precision of entry and exit levels. Acting too early or too late—even by a few points—can compromise an otherwise solid trade. Always size positions according to your account, and never let emotion override logic. Risk management isn’t a side-note—it’s the foundation that separates professionals from those who simply speculate.
When charting futures, the data provided could be delayed. Traders working with the ticker symbols discussed in this idea may prefer to use CME Group real-time data plan on TradingView: www.tradingview.com - This consideration is particularly important for shorter-term traders, whereas it may be less critical for those focused on longer-term trading strategies.
General Disclaimer:
The trade ideas presented herein are solely for illustrative purposes forming a part of a case study intended to demonstrate key principles in risk management within the context of the specific market scenarios discussed. These ideas are not to be interpreted as investment recommendations or financial advice. They do not endorse or promote any specific trading strategies, financial products, or services. The information provided is based on data believed to be reliable; however, its accuracy or completeness cannot be guaranteed. Trading in financial markets involves risks, including the potential loss of principal. Each individual should conduct their own research and consult with professional financial advisors before making any investment decisions. The author or publisher of this content bears no responsibility for any actions taken based on the information provided or for any resultant financial or other losses.
Indexfutures
"US30 Heist Alert: Thief Style's Bullish Plan to Steal Profits!"🌟 Salut! Ciao! Hola! Konnichiwa! 🌟
Dear Wealth Raiders & Market Bandits, 🤑💰✈️
Here’s our slick *Thief Trading Style* heist plan for the **US30 / Dow Jones Industrial Average Cash** Index, crafted with sharp technicals and fundamentals. 💥 Stick to the chart’s long entry strategy and aim to slip out near the spicy Yellow ATR Zone—a risky, overbought level where bears and traps lurk. 🏆💸 *Grab profits and treat yourself, you’ve earned it!* 💪🎉
**Entry 📈**: The heist kicks off! Watch for a breakout above the MA line (42600.0) to jump in—bullish riches await! 🤑 Set *buy stop orders* above the MA or *buy limit orders* near the most recent 15/30-min swing low/high for pullback entries. 🚨 Set an *alert* to catch the breakout signal!
**Stop Loss 🛑**: Yo, thieves, listen up! 🗣️ For buy stop orders, hold off on placing that stop loss until the breakout confirms. 🔊 Place it at the 8H recent/swing low (40850.0) for day/swing trades. Adjust SL based on your risk, lot size, and number of orders. Play it smart, or it’s your loot on the line! ⚠️🔥
**Target 🎯**: Aim for 44500.0 or bail before the target hits. 🏴☠️
**Scalpers, eyes here 👀**: Stick to long-side scalps. Big bankrolls can dive in; smaller ones, join the swing trade heist. Use *trailing SL* to lock in your haul. 💰
💸 **US30 Market Heist Outlook**: The index is neutral but leaning bullish, fueled by key drivers. ☝ Check the fundamentals, macroeconomics, COT reports, geopolitics, sentiment, intermarket analysis, and future trend targets for the full score. 🌎🔗
⚠️ **Trading Alert: News & Position Management** 📰🚫
News can shake the market hard. To protect your loot:
- Skip new trades during news releases.
- Use trailing stop-loss orders to secure running profits.
💖 Boost our heist plan! 🚀 Hit that *Boost Button* to power up our robbery squad. With *Thief Trading Style*, we’re snatching profits daily. 🏆🤝 Stay sharp for the next heist plan! 🤑🐱👤🤩
---
### Latest Real-Time Data (UTC+1, May 16, 2025) 📊
*Data sourced from reliable platforms like Financial Juice and official market feeds.*
**Indices** 📈
- US30 (Dow Jones): 42580.0 | +0.18% 😊
- S&P 500: 5720.5 | +0.12% 😄
- NASDAQ 100: 20150.2 | +0.25% 😊
- FTSE 100: 8250.3 | -0.05% 😐
---
### Latest COT Data (Updated Friday, May 9, 2025) 📑
*Commitment of Traders (COT) report for US30/Dow Jones futures, sourced from CFTC.*
- **Non-Commercial (Speculators)**:
- Long: 45,200 contracts | +2,500 😄
- Short: 38,900 contracts | -1,200 😊
- Net Position: +6,300 (Bullish bias) 🟢
- **Commercial (Hedgers)**:
- Long: 82,500 contracts | -1,000 😐
- Short: 90,700 contracts | +800 😐
- Net Position: -8,200 (Bearish hedge) 🔴
- **Open Interest**: 165,400 contracts | +1,200 😊
- **Key Insight**: Speculators are increasing bullish bets, while hedgers lean bearish, signaling potential volatility near resistance levels like the Yellow ATR Zone. ⚠️
---
💥 Join the *Thief Trading* crew, boost the plan, and let’s raid the markets together! 🤑🚀

HK50 Heist Alert: Snatch the Bullish Loot & Escape the Red Zone!🌎 Greetings, global fortune hunters! Bonjour, Shalom, Salut, Hola! 🌟
Dear Cash Commanders & Market Marauders, 💰⚡️
Forged in the 🔥 Rogue Trader’s crucible of technical and fundamental sorcery 🔥, here’s our sly scheme to plunder the HK50 “HongKong50” Index Market. Stick to the chart’s blueprint, homing in on long entries. Our endgame? Sneak out near the perilous ATR Red Zone, where overbought signals, consolidation, trend reversals, and traps await, with bearish outlaws ready to pounce. 🏴☠️💸 “Lock in profits and spoil yourself, traders—you’re unstoppable!” 🎉💥
**Entry 📈**: The safe’s wide open! Grab the bullish treasure at any price—the raid’s in motion!
For sharper moves, place buy limit orders on a 15 or 30-minute chart at the most recent swing low or high. Hot tip: set chart alerts to stay one step ahead!
**Stop Loss 🛑**:
📍 Rogue SL anchored at the recent swing low on the 4H timeframe (22700.00) for day or swing trades.
📍 Adjust SL based on your risk tolerance, lot size, and number of open orders.
**Target 🎯**: Aim for 24700.00—or slip away early if the market turns dicey!
🧲 **Scalpers, stay sharp!** 👀: Focus on long-side scalps only. Big bankroll? Jump in now! Smaller stack? Team up with swing traders for the heist. Use trailing SL to guard your gold 💰.
💵 **HK50 Market Heist (Swing Trade Breakdown)**: Sitting in a neutral zone with a bullish spark, driven by key market currents. ☝
🗞️ **Dig into the details**: Explore Fundamental Insights, Macroeconomic Trends, COT Reports, Geopolitical Shifts, Sentiment Signals, Intermarket Connections, Index-Specific Factors, Positioning, and Future Targets for the full picture! 👉🔗🌍
⚠️ **Trading Alert: News & Position Tactics** 📰🚨
News events can rattle markets like a tempest. To protect your profits:
- Steer clear of new trades during news releases.
- Deploy trailing stop-losses to secure gains and shield open positions.
💖 **Power up our raid!** 💥 Tap the Boost Button 💥 to amplify our profit-snatching prowess. Join the Rogue Trading Style posse and rake in riches daily with finesse. 🏆🤝🚀
See you at the next market ambush—stay vigilant! 🤑🐱👤🎯

Russell continues downhillThe Russell 2000 small-cap index having failed to maintain support at 1968, a short futures position might be worth adding to. We wouldn't start one here, though.

Dow bull not yet ragingSomebody whispered "new bull market!" into our ear overnight. Bull or no, we think DJIA futures have a bit further to pull back from recent overbought levels before the stampede begins in earnest.
Traders who agree can either short the September Dow futures, as here, or pick up some AMEX:DOG or $SDOW.

NAS100 Outlook 2/12I see reasons for indices to continue to appreciate. Looking to take out a significant HTF high before my bias switches bearish . CPI on tuesday. will be trading after that occurs.

NAS Outlook 1/22Bearish on indices, looking to see if last week's high holds. watching intraday for trade opportunities.

NAS100 Outlook 1/15Looking for indices to fall early and give a good entry for longs, to then chase the buyside.

US500 Outlook 1/15Looking for indices to fall early and give a good entry for longs, to then chase the
buyside.

US500 Outlook 1/8Seeing potential weakness across the indices. expecting it to trade a bit higher however. See NAS idea for further analysis.

NAS Outlook 1/85 minutes ago Seeing reasons for NAS to go down this week, however, this is at odds with DXY and the two are usually somewhat inversely correlated. Will be seeing what opportunities actually present, but this is what i see at the present moment. Slow news week till thursday so dont be surprised by a mon-wed consolidation/liquidity range building following friday's expansion.

US30 Outlook 1/8Seeing weakness in the indices, looking for price to continue upwards to fill efficiencies before the potential reversal. Slow news week, not expecting anything major before thursday.

$SPX - Reversal comin next quarter.... Maybe. At..3250?Above is the monthly
The biggest thing I see After my analysis is the possibility of it getting down to the support level of the breaker that formed at the beginning of the pandemic. It has bounced off current breakers but has yet to close abnove a brreak of structure leading m,e to beleive it will find the lowest pointy at thast pandemic high breakers candle low price of 3280 (ish) before we see a bullish movement again or even a break of structure. I think this quarter (what's left of iot) and next quarter is going to be tough.
Below is the Daily
It's the secoind quarter nexxt year that's going to be the true test in my opinion. But this is my take on the trusty Standard and poor. just by logive and reasoning. Trendlines are phantoms, price will brersk through those without thin kking about trendlines because price doesn't know what it is, but it does remember price points, so the low of the High pandemic breaker I think will be the last or first quarters low point. We'll have 90 from there to make a good swing high.
The daily briefly breaks structure but immediately closes bnelow structure righjt after. This just has slow growth written on it for at least 6-8 weeks.
OANDA:SPX500USD
CME_MINI:ES1!
FINRA:NANO_SHORT_VOLUME
CBOE:NANOS
CME_MINI:ES1!
\ CME_MINI:ESG1!


Nasdaq bearish tonePrice of Nasdaq in 2021 was the powerhouse and create a lot of wealth. We see that price has started to decline from the top of 16,500. A potentially renounce could happen around 14,400 before coming down lower to 13,500
We are in the view of overall bearish sentiment in Nasdaq

HSI To be Strong in the next 6 monthsHSI has start to bottom up showing that confidence in Hong Kong market has start to show in the current market.
Price has broken up above box to show that immediate target to be 25,600.
We should expect price continue to consolidate along 23,000 - 26,400 and eventually start to go back up to 30,000 in the next 6-8 months time.
This favours heavily sold stock in China especially those blue chips and poise a strong recovery in the months to come.
We have an initial target at 28,000 - 29,000

nifty technical analysis looking strong 21-01-22technical analysis of nifty for monday.....trading with physiology ......

M2K set up for a super rare 4:1 R:R and possible crash!The Russell Micro is set up with a SUPER rare short opportunity here and possible crash. The 4H has made its third trend lower is under it's VWAP from highs and has put in a doji on the lows. The trade here is a pullback to 2065.5 with a stop at 2085.5 target at 1980 giving a 1:4 risk to reward ratio. I haven't seen a short setup like this in US equities in a VERY long time... as in, August 2008.

By May 24, 2021 it's all over! US (world) Index final collapseThis is the Dow Industrial Average - Weekly. (Price & Time)
This is only a 2-D Time Slice of a high(er) dimensional wave analysis (see - attachment), with standard Price projection onto the Time axes. (Will add the rest as time allows.)

us100Hello traders, here is the analysis from our team :
sell: 11098
target #1 11095
Target: 11085
Stop : 11111
Money management : 11095
Part #1 of spread trade.
Let us know in the comment section below if you have any questions.😉

Prediction of index futures from 8 June onwardAttention guys we are going to complete "V" pattern for Victory except for NASDAQ
NASDAQ continue to victory or resting a bit? lets find out next week...

Prediction for E-mini index futures from 11 may 2020this is the prediction of how index futures may go for next week starting 11 May 2020
as you can see there are perfect elliot impulse wave (12345) then correction wave ( ABC )
we are going to phase C this week
so be prepare (to short trade?) !!!

es, spy, day trading for Mar 24th 2020Lines on SPX500 chart are 6 points higher than I am using for ES
ES has taken a nice upward move over night but is still below the prior sessions overnight move, however is taking a hard look at trying to move higher into last weeks distribution so first target is the middle of last Friday's range and if higher will look at Friday's top as next up side target.
Will be watching how the market reacts at the red bottom and this is the spot I look for either a bounce back up or a failure back into yesterday trading range and the lows it printed yesterday.
Red bottom break is close to the point my bull bias starts to fade away.
If you like my posts please give thumbs up or post any questions or comments, I like to know every now and then my work is helping a few.
