playing a dangerous game with vixthe vix, vx1! and s&p500 volatility index is making its rounds around a pivot price. if we cross above that and trama i would look for a test of sss moving average and upperhorizontals. if we staybeneath pivot and trama i wouldlook for continued weakness and lower horizontals. uvxy is the instrument to play.
Indextrading

is this daily rejection from resistance or a bear trap?SPY and emini es1! futures have signaled the start of daily consolidation for the S&P500, and a rejection from the monthly trendline. this idea is simple. if we confirm a lower monthly high, and the beginning of a reversal by remaining below the pivot i would aim for sss supports and lower horizontals. if we remain rangebound, and break out above pivot i would aim for upper horizontals. this resistance is stiff, and it would not be surprising to see SPXL a good 4-8% lower here. im tracking the underlying index with SPY, but the instrument i would use is SPXL. if we gap up id wager intraday turns bearish, and if we gap down i would look to close that gap with bearish activity to follow.

SPX Daily TA Neutral BullishSPXUSD Daily neutral with a bullish bias. Recommended ratio: 55% SPX, 45% Cash.
* The Fed Minutes confirmed preexisting knowledge that inflation is still the primary concern for the economy (making this release a low impact event) and that more downsizing of the Fed balance sheet + another 50bps is the baseline scenario for the next FOMC meeting on 09/21. Fed Staff (FOMC) agreed that 3.4% is the current peak target rate for FFR, the current range is 2.25%-2.5% implying that perhaps two 25bp rate hikes will follow September's anticipated 50bps hike to end the year. Some participants (Fed members) commented on how commodities (primarily energy and food) are likely to keep inflation up in the near term, some Participants mentioned that the policy adjustments are already seeing a substantial effect but almost all agreed that most of the effects haven't been felt yet, and most participants agreed that they support rate hikes until PCE is closer to the 2% long-run target. July US Retail Sales stayed roughly the same as in June and posted ~0% change compared to estimates of 0.1% (sales are still up 9.2% from July 2021), this surprised many analysts who expected more spending with the recent significant reduction in gas prices. Key Upcoming Dates: S&P US August PMI at 945am EST on 08/23; US Q2 Final GDP Estimate at 830am EST 08/25; US July PCE at 830am EST 08/26; UofM Final August Sentiment Survey Index at 10am EST 08/26; Jackson Hole Economic Symposium on 08/25-08/27.*
Price is currently testing $4254 minor support after being rejected by the upper trendline of the descending channel from November 2021 + the 50 MA at ~$4325. Volume remains consistently Moderate and broke a three day streak of buyer dominance with a seller dominated close in today's session; this was a capitulation type of initial reaction which is indicative of a critical resistance. Parabolic SAR flips bearish at $4220, this margin is bearish. RSI is currently testing 68.42 support after forming a soft peak at 73. Stochastic is bearish and currently trending down at 87; it remains in the 'bullish autobahn zone' which is mildly bullish at the moment. MACD remains bullish but is beginning to trend sideways as it forms a soft peak just above the ATH (91.78) at 93.54; it has been bullish for 54 days now, implying that perhaps this is more than just a bear market rally. ADX is currently trending up at 31 as Price continues to push higher, this is bullish at the moment.
If Price is able to bounce here at $4254 minor support then it will likely retest the upper trendline of the descending channel from November 2021 + the 50 MA at ~$4300 as resistance . However, if Price loses $4254 minor support , it will likely retest $4175 support before potentially retesting the uptrend line from 06/16 at ~$4k psychological support. Mental Stop Loss: (one close below) $4226.

looks like were headed for consolidation in SPXweve had a big runup to major resistance, and were inside that sss supply zone below a pivot marked out by the dotted line. if we stay beneath that area treating it as resistance i would aim for the lower horizontals looking to retest the sss moving average or signal. if we breech that resistance to the upside i would aim for the upper horizontals. most likely scenario is a move up to close the gap in the underlying index, or at least some bounce followed by continued downside and consolidation.

US30 ShortThis is what i'll be watching for on US30. 15min RSI Divergence to form, then a huge drop to follow. Atleast a 1:12 trade here coming up.

Could CPI data help the US30 confirm a continuation? Hi, and welcome to today’s update. In today’s video update, we’re looking at the US30 and wondering if today’s CPI could break the consolidation deadlock we are currently seeing price sitting in.
Price continues to be held in an ascending triangle pattern, and in uptrends, these are typically seen as continuation patterns. We can clearly see that price remains in an uptrend, so if we see better than expected CPI data today, could that be a driver that sets off buyers? Better than expected data could tell the market that peak inflation could be here and that rates could move into a holding phase or at least see a smaller increase.
But if we see worse than expected data, this could set the pattern up to fail, and we could see a new break lower. For now, we will look for the current trend to remain in play until we see further price action telling us otherwise.
US CPI data is due out at 8:30 am EST. Good trading, and enjoy your Wednesday.


a couple scenarios for critical resistancethere are a couple scenarios for the critical resistance weve just about come up to on the l nasdaq. i think were above pivot, and where we start out friday will define next weeks activity. if we hit that resistance sss moving average, and we fall beneath the pivot forming bearish divergence daily rsi i think were headed for daily consolidation. if we breech that first upper horizontal embedding bolinger bands and treating the crucial area as support i think were in for continuation until rsi comes out of overbought.

SPX Daily TA Neutral BearishSPX Daily neutral with a bearish bias. Recommended ratio: 48% SPX, 52% Cash. * NANCY PELOSI WATCH. S&P Global released their final July US Manufacturing PMI estimate this morning and it came in at 52.2, slightly lower compared to both June's PMI and the consensus estimate of 52.3; this is the lowest it has been since July 2020. The Atlanta Fed released their second GDPNow Q3 estimate today and it came in at +1.3%, down from the initial estimate of +2.1% on 07/29/22. According to Reuters, CNN and 'Taiwanese media', Nancy Pelosi is scheduled to visit Taiwan tomorrow against the wishes of the PRC; though military countermeasures have been promised but are not expected, if this does happen it would surely shake up markets due to the uncertainty regarding how mainland China will respond. Key dates remaining this week: Nancy Pelosi potentially visiting Taiwan tomorrow night (08/02) and speaking to lawmakers and human rights groups on Wednesday (08/03); St. Louis Fed President James Bullard speaks @ 645pm EST (08/02); Cleveland Fed Loretta Mester speaks 12pm EST (08/03); July BLS Employment Situation @ 830am EST (08/04).* Price is currently facing some selling pressure at ~$4120 as it aims to retest $4175 resistance. Volume is Moderate and on track to favor buyers for a fourth consecutive session if it can close today in the green. Parabolic SAR flips bearish just below the 50 MA at $3900. RSI is currently trending down slightly at 65 after forming a peak at 66 (just below 68.42 resistance); Hidden Bearish Divergence between Price and RSI can be seen from 06/02/22, this is significant due to the potential local Double Top formation. Stochastic remains bullish but is trending down at 98.5 after testing max top for the first time in ten sessions; if it breaks below 93.5 it would be a bearish crossover. MACD remains bullish for the 38th consecutive session and is currently trending up at 49.50 as it approaches 55 minor resistance with no signs of peak formation. ADX is currently trending up at 19 as Price pushes higher, this is mildly bullish. If Price is able to push higher then it will likely formally retest $4175 resistance where it may see a bit of selling pressure. However, if Price breaks down here, it will likely retest the uptrend line from 06/16/22 as support at ~$4k . Mental Stop Loss: (one close above) $4175.

vix seems like its headed for some cumulative supportif vix loses the 1 hour uptrend, im guessing it will double bottom

a harmonic fractal pattern for dxy as bears take overi think a counter trend rally to the upside may attempt fractally out as bulls stutter in defense and eventually get fakedout in reversal from the lower timeframes up to the higher by fibo timezone 5, 8 and 13

US100 Long 1h Wyckoff Trailing StopThis analysis is based on the scenario that we are about to complete the schematic with a following rally.
A possible position can be placed like:
-50% of total position size on the LPS after we have seen some Sign Of Strength.
-50% of total position size on the LPS after we have seen the Sign Of strength of the smaller area. (something more that 12865)
Scaling stop loss starting (11698) and after the final position becoming something less than (12380).
Target being the good reference point of (14248).

vix coming to critical level of supportweve only seen this low in uvxy 3 times, they were all this year, and they all happened with broader markets in a downtrend. all im seeing right now is buys on uvxy, and if the selloff continues with multiple sectors like xlf, xlv, spy, qqq, iwm, and especially soxl hitting new lows of the day at the same time its almost a guarantee that vix pops once again at this level on the daily targeting the upper horizontal (high 13s/low 14s), and if the bounce continues with sector rotation occuring and consolidation forming in major indices this etf is headed for the lower horizontal (high 8s/low 9s).

DXY Daily TA Cautiously BearishDXY Daily cautiously bearish. Recommended ratio: 25% DXY, 75% Cash. * US Treasury Secretary Janet Yellen was interviewed by NBC and explained that due to strong consumer demand, credit quality and employment, the widely anticipated two consecutive quarters of negative GDP would not constitute a recession. She is essentially the White House mouthpiece for the state of the economy and is saying that a healthy labor market and a strong consumer (she's referring to growing retail sales, positive GDI growth and "healthy" consumer credit) are currently saving the US from an economic recession. The Consumer Confidence Index (the leading gauge of US consumer confidence) is scheduled to report tomorrow (07/26) at 10am (EST), it has fallen for the past two months and is now at the lowest level since February 2021. The University of Michigan Consumer Sentiment Index is currently projecting a rise in confidence from June to July and is scheduled to report at 10am (EST) on 07/29. With increases in layoffs and announced slowdowns in hiring I'm legit curious to know how the Employment Situation looks on 08/05; both the Federal Reserve and the US Treasury Department are notorious for relying upon lagging data, time will tell if this is one of those cases. With regards to the DXY there are two bullish catalysts at work here: 1) continued geopolitical turmoil and the resulting supply chain disruptions (leading to food and energy shortages) are pushing investors to US treasuries and 2) increases to FFR spillover into increases to overall economic rates, which typically push those looking for higher rates of return to dollar-denominated assets which in return pushes DXY higher. The current consensus on the EOY FFR from both money markets and FOMC members is around 3.25-3.5%, we are currently at 1.5%-1.75% (effective is currently 1.58%). That said, if the projected increases in FFR are to in fact take place AND the global geopolitical/supply chain situation continues to worsen, it would be reasonable to see DXY at 2000-2002 levels (~$120). Reminder that there was a "technical" US recession from March 2001 to November 2001.* Price is continuing to trend down at ~$106.50 after being rejected by $108 resistance; it is also forming a Bull Flag and may attempt to retest $108 resistance in the near term. Parabolic SAR flips bullish at $108.57, this margin is neutral at the moment. RSI is currently trending down at 52 and is beginning to form a soft trough after getting rejected by 59 resistance; the next support is the uptrend line from July 2020 at ~45. Stochastic remains bearish and is currently forming a trough as it attempts to cross over bullish at max bottom. MACD remains bearish and is currently testing 0.65 support with no sign of trough formation. ADX is currently trending down at 34 with no sign of trough formation as Price continues seeing selling pressure, this is mildly bearish at the moment. If Price is able to bounce here at ~$106.50 then it will likely retest $108 resistance . However, if Price continues to break down, it will likely retest the 50 MA (for the first time since May) at ~$105 . Mental Stop Loss: (one close above) $108.

SPX Daily TA BullishSPX Daily bullish. Recommended ratio: 90% SPX, 10% Cash. *Equities, Cryptos, Metals, Oil, Treasuries and EURO are slightly up today as DXY and VIX continue their market correction. Equities continue to go up on fading concerns of a recession paired with more strong earnings ( Tesla beat on both earnings and revenue ) but face a week of anticipated volatility with big tech companies (Meta on Wednesday and Amazon and Apple on Thursday) set to report earnings next week. For context: Netflix just reported a beat on earnings (earnings were lower in Q2 then in Q1) and miss on revenue after completing their second round of layoffs and experiencing its second consecutive quarter of declining new subscribers ; Snapchat also reported a beat on earnings (no change from Q1 and Q2) and miss on revenue while announcing they will slow hiring . This and the worsening energy crisis in Europe that is expected to get worse are pointing to increased volatility next week. Putin suggested that whether or not the Nord Stream returns to full capacity depends on how the Canadians handle the repair of a pipeline turbine and how the Germans handle sanctions regarding transporting the turbine and maintaining the pipeline. The EU continues to contend that Russia had reduced the Nord Stream's capacity by 40% even prior to scheduled maintenance and that punishing the EU economy with a winter energy crisis is part of Russia's plan. The ECB raised their central bank interest rate for the first time in 11 years from 50bps from -0.50% to 0% in response to a June 8.6% inflation reading; with a looming energy crisis the EU may soon learn this may not be enough. Key Dates next week: FOMC Statement release 07/27 at 2pm (EST), Meta Earnings Report 07/27, and Amazon and Apple Earnings Report 07/28.* Price is currently trending up at ~$4k and flipped $3938 resistance to support in today's session while also reclaiming the descending channel from August 2021 at the same level ($3938 resistance-turned-support). Volume remains Moderate (high) and has favored buyers for three consecutive sessions now at this critical price juncture, this is bullish. Parabolic SAR flips bearish at $3734, this margin is mildly bearish at the moment. RSI is currently trending up at 60 with no signs of peak formation; the next resistance is at 68 but RSI still hasn't technically established 53 as support so a downward correction cannot be ruled out. Stochastic remains bullish and is currently testing max top where it can coast in the 'bullish autobahn' for a few sessions. MACD remains bullish and is currently trending up at 1.60 as it breaks out above -11 resistance, if it can continue the breakout then the next resistance is at 11. ADX is currently trending down slightly and beginning to form a soft trough at 16 as Price pushes higher, this is mildly bullish; if ADX can begin trending up as Price continues going higher, this would be bullish. If Price is able to continue up then the next likely target is a retest of $4175 resistance for the first time since early June 2022. However, if Price breaks down here, it will likely retest the lower trendline of the descending channel from August 2021 at ~$3900 . Mental Stop Loss: (one close below) $3900.

US30 - Dow Jones Short Selling set up
Selling Set up for down
After good Recovery on daily chart. dow are tend to go bullish for 1 week.
between that upside move, price are looks bearish in 1 hour chart.
trend is down on 15min which is good indication for selling.
On Execution time frame(5Min) good zone Are there.
That's why shorting is goo till 31373

NAS100Hello Traders, here is the full analysis for this pair, let me know in the comment section below if you have any questions, the entry will be taken only if all rules of the strategies will be satisfied. I suggest you keep this pair on your watchlist and see if the rules of your strategy are satisfied.
The way I told you, you have to trade like this and you will have more profit always and you will not be a loss.
1. Daily Share Analysis Chart
2. Technical Knowledge
3. Fundamental Knowledge
4. Trading Signal
if you want to join my team come to inbox

ASX200 4H, could we see a new test of 6715?Happy Monday. Thanks for tuning in. Today we’re looking at the ASX200 as a few things point to buyer control. Since last Friday, we continue to watch the new fast uptrend remain in play. Buyers are also starting to break out of a wedge pattern, but we want to see if price can get back up to and break 6715.
A move up to and break of that level could start to tell us that a new short-term up trend is underway.
Thanks to all our subscribers and to the trading community for watching today’s update. We wish you good trading for the rest of the day.

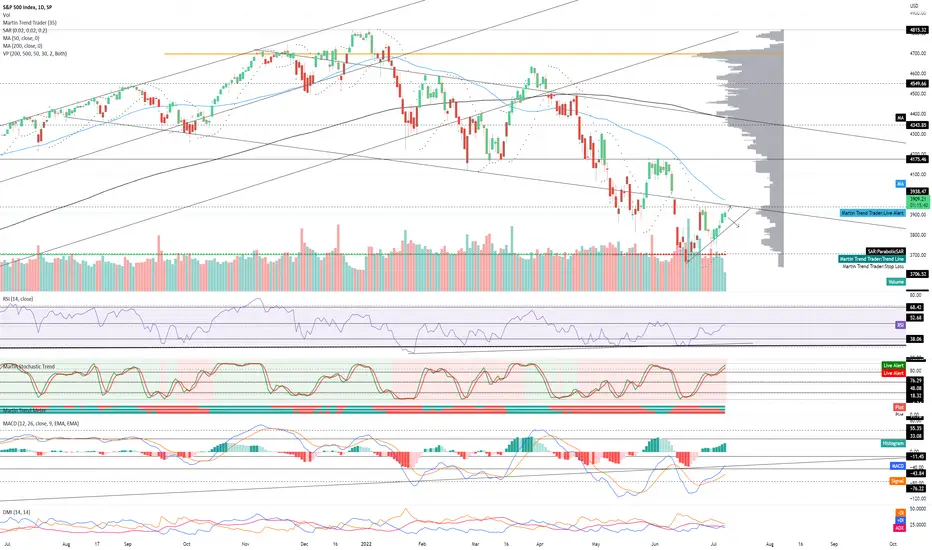
SPX Daily TA Neutral BearishSPX Daily neutral with a bearish bias. Recommended ratio: 45% SPX, 55% Cash. * US June Retail Sales was reported this morning and beat the consensus estimate (0.8%) by 0.2% coming in at 1%; compared to last month's retail sales number of -0.1%, it's reasonable to suggest that consumer demand is returning after six consecutive months of shrinkage (Jan 2.7%, Feb 1.7%, March 1.2%, April 0.7%, May -0.1%). One of the primary goals of the Fed raising FFR is to temper economic activity (lessen demand). The Fed announced QT and the possibility of rate hikes in December of 2021, what followed was six months of Retail Sales (consumer demand) shrinkage; the Fed didn't start raising FFR until March 2022 and QT began in June 2022, a testament to how powerful even just words from the Fed can be. This is relevant because these are things to consider when determining how far ahead or behind money markets are, and begs the question once again, have financial markets already priced in a recession? It's hard to say when Federal Reserve Governor Waller says he needs to review Retail Sales and Housing Starts before committing to a more than 75bps rate hike on 07/27 , while St. Louis Federal Reserve President Bullard says that Core PCE inflation hasn't peaked yet but that there isn't too much difference between 75bps and 100bps on 07/27. Equities, Cryptos, and Commodities (aside from Gold, Copper, Palladium, Wheat and Soy) are up; Treasuries, VIX, DXY down. Housing Starts and Building Permits numbers are to be released at 830am (EST) on 07/19.* Price is currently trending up at $3870 and is on the verge of testing the uptrend line from 06/16 at $3880 as resistance after bouncing at $3707 minor support. Volume is currently Low and on track to favor buyers for a third consecutive session. Parabolic SAR at $3938 minor resistance, this margin is mildly bullish. RSI is currently trending up at 49 after bouncing at 42, the next resistance is at 53. Stochastic is on the verge of crossing over bullish at 37 after bouncing at 25; the next support is at 18 and resistance at 48. MACD is currently trending up at -31 after bouncing at the uptrend line from March 2020 at -37 as support (which is simultaneously reversing a soft peak formation), the next resistance is at -11. ADX is currently trending sideways at 20 as Price is pushing higher, this is neutral at the moment; if ADX was to start trending up with Price this would be bullish, and if it trends down as Price goes up this would be bearish. If Price is able to break above the uptrend line from 06/16 at $3880 , it will be forced to contend with the lower trendline of the descending channel from August 2021 at $3938 minor resistance . However, if Price is rejected here then it will likely retest $3707 minor support before potentially retesting $3508 minor support for the first time since November 2020. Mental Stop Loss: (two consecutive closes above) $3938.

Where US30 Is headed to next?Us30 has taken bearish hits since the beginning of this year. If it stays below $33,480 and continues back to the lows at 29,670 and further, we could see further decline.
Not only for US30, but for the stocks within the index. Before that happens price could pullback towards 32,500 giving the buyers some opportunity and hopes of recovery. That's just a thought until it happens.
For now, the Dow is bearish and if there is hopes of true recovery price will have to push up pass 33,480 and continue up from there.

SPX Daily TA Neutral BearishSPX Daily neutral with a bearish bias. Recommended ratio: 35% SPX, 65% Cash. *Money markets continue struggling to find a bottom amidst high and rising global inflation. CPI report comes out tomorrow (07/13) at 830am (EST) , market consensus is around 8.8% (8.6%-8.9% range); if it comes in on the high end or higher, a sell-off will likely ensue. The next FOMC meeting is on 07/26-07/27 and the next FFR rate hike will be released in the Fed statement at 2pm (EST) on 07/27. Richmond Fed President Thomas Barkin stated today that he thinks that a 50-75bps rate hike this month is "reasonable" but cautioned against going too far and "inadvertently breaking something". The San Francisco Federal Reserve published research last month showing that demand is only 1/3 responsible for inflation and that supply chain disruptions are responsible for about 1/2 of inflation; this implies that the Fed can only do so much to ring in inflation and that a lot of it depends on Russia's attack on Ukraine and China's 'Zero Covid Policy'. Until inflation is tamed, it's reasonable to expect for more recessionary fears to mount heading into the second half of the year, especially with the risk of the global geopolitical situation (and therefore supply chains) getting worse.* Price is currently trending down at $3800 after being rejected by the lower trendline of the descending channel from August 2021 at $3938 minor resistance and is technically still testing the uptrend line from 06/16/22 as support. Volume remains Moderate and has favored sellers for two consecutive sessions now. Parabolic SAR flips bearish at $3734, this margin is mildly bearish. RSI is currently trending down at 44 with no signs of trough formation after forming a Double Top just below 53 resistance, the next support is at 38. Stochastic remains bearish for a second consecutive session and is currently testing 76 support as it falls out of the 'bullish autobahn zone'. MACD remains bullish and is currently forming a soft peak as it tests the uptrend line from March 2020 as resistance a little above -44 resistance. ADX is currently trending sideways and is beginning to form a soft trough at 20 as Price is trending back down, this is mildly bearish; if ADX is able to bounce here as Price continues to break down, this would be bearish. If Price is able to bounce here then it will likely retest the lower trendline of the descending channel from August 2021 at $3938 minor resistance . However, if Price breaks down out of the uptrend line from 06/16/22, the next likely target would be a retest of $3707 minor support (and potentially lower). Mental Stop Loss: (two consecutive closes above) $3938.
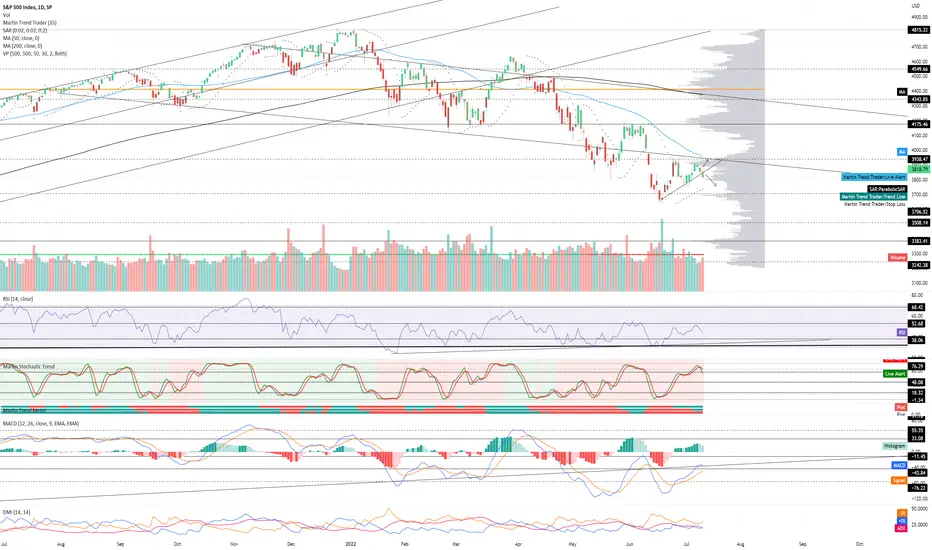
SPX Daily TA Neutral BullishSPX Daily neutral with a bullish bias. Recommended ratio: 52% SPX, 48% Cash. * June CPI report is scheduled for release at 830am on 07/13 and the consensus estimate is 8.8%, if the number comes in higher than that (which many pundits are predicting) then a market sell-off is to be expected. The Euro continues to bleed as it approaches parity with USD for the first time in 20 years as USD and RUB both edge higher. Oil, Gold, Cryptos, Treasuries and Equities are all down as global inflation numbers keep coming in higher; the VIX is also higher. UK Prime Minister Boris Johnson resigned; Sri Lanka's economy is currently collapsing due to bankruptcy as their nation endures food and fuel shortages; Iran appears to be pushing forward with uranium enrichment while strengthening Yemeni ties - making Israel, UAE and Saudi Arabia become increasingly fearful and potentially willing to collaborate defensively; Russia is gradually expanding through the Donbas region (with Donetsk being one of the last strongholds to prevent annexation of the Eastern Oblast) while Lithuania enters the fray by blocking trade/transit between Russia and Kaliningrad - Putin also recently stated that the offensive against Ukraine has barely begun; and lastly the situation between China and Taiwan appears to be escalating month to month while mainland China is still dealing with 'Zero-Covid' and recent civil unrest from Chinese bank clients who have had their assets frozen. That said, the bearish catalysts keep piling up as financial markets continue looking for a bottom; so at this point in time it's reasonable to say that financial markets are still at the whim of the Federal Reserve, and because the Fed isn't done moving to a 'restrictive monetary policy' it's therefore reasonable to assume that there is more potential downside. However, it's prudent to remain vigilant because of one question, at what point have financial markets already priced in a recession?* Price is currently testing the uptrend line from 06/16 at ~$3850 after being rejected by the lower trendline of the descending channel from August 2021 at ~$3925 for a second time in a month. Volume remains Moderate and is currently on track to break a five day streak of buyer dominance if it can close today's session in the red; according to Volume Profile, Price is also currently facing resistance at the third largest supply/demand zone on the chart. Parabolic SAR flips bearish at $3725, this margin is neutral at the moment. RSI is currently trending down at 46 after being rejected by 52.68 resistance for the second time in a month; the next support is at 38. Stochastic is currently crossing over bearish at 91 as it risks falling out of the 'bullish autobahn zone'; the next support is at 76. MACD remains bullish and is currently testing the uptrend line from March 2020 at ~-$35 as resistance while also still technically testing -44 resistance; if MACD is rejected at the uptrend line and then falls back below -44, this would be very bearish. ADX is beginning to form a soft trough at 19 as Price is seeing some recent selling pressure, this is mildly bearish. If Price is able to bounce off of the uptrend line from 06/16 at ~$3850 then it will likely retest the lower trendline of the descending channel from August 2021 at $3938 minor resistance . However, if Price breaks down out of the uptrend line from 06/16 at ~$3850, then it will likely retest $3707 minor support . Mental Stop Loss: (one close below) $3815.

SPX Daily TA Cautiously BullishSPX Daily cautiously bullish. Recommended ratio: 69% SPX, 31% Cash. * The US Jobs Report came out this morning and 372,000 jobs were added in June which essentially recovers almost all of the jobs lost due to the pandemic (~23m) , the unemployment rate remained at 3.6% for the fourth month in a row. A technical recession is defined by the combination of declining economic growth and employment ; so according to the textbook we are not yet in one because unemployment is still low and credit is still relatively healthy(?). How reliable the employment data is and how effective the models used to analyze them are arguable but as it stands now, the growing number of layoffs hasn't hit the job market yet. Even though they are both connected, markets seem to have shifted their focus from inflation to Q2 corporate earnings as a means of determining how much of an economic slowdown we are to expect (which would determine if we end 2022 with a federal funds rate above 3.5% - it is currently at 1.58%). Russia continues to avoid Western sanctions and boost their Ruble by fortifying trade routes with Brazil, China, India and South Africa (amongst other countries); Donetsk and Severodonetsk are the last two major Ukrainian strongholds defending against a total annexation of the Donbas region (Southeastern oblasts) - and Russia likely won't stop there; and Russian Foreign Minister Lavrov reiterated today at the G20 Summit (before storming out) that increased sanctions are viewed as declarations of economic war.* Price is currently pushing higher at ~$3900 as it approaches the lower trendline of the descending channel from August 2021 at $3938 minor resistance. Volume remains Moderate and is currently on track to favor buyers for a fifth consecutive session if it can close today's session in the green. Parabolic SAR flips bearish at $3714, this margin is neutral at the moment. RSI is currently trending up slightly at 52 as it tests 52.68 resistance with a soft peak beginning to form. Stochastic remains bullish and is currently trending up at 98 as it approaches a test of max top where it can potentially coast in the "bullish autobahn zone" for some time. MACD remains bullish and is currently testing the uptrend line from March 2020 at -44 resistance, this is a critical resistance area. ADX continues trending down at 20 as Price pushes higher, this is mildly bullish at the moment; if ADX bounces as Price continues higher, this would be bullish. If Price is able to continue up here then it will likely face a bit more resistance at the lower trendline of the descending channel from August 2021 at $3938 minor resistance . However, if Price breaks down here, it will likely retest $3706 minor support before potentially heading lower to test $3508 support for the first time since November 2020. Mental Stop Loss: (one close below) $3815.