13 january bank niftyWhen market gap up opening so market still down otherwise opening seam precise so I thinking market was green but most probability market gone up said becose market creact cup and handle pattan
note the leval
India

ICICIGI - ACCUMULATION OR DISTRIBUTION?NSE:ICICIGI
ICICIGI formed a good trading range.
its been consolidating for 25 days now with a total volume of 10.5 Million shares.
Big players are getting it ready for a big move as they are slowly building positions in the stock.
I will watch for a breakout to the one side with above-average volume.
#Breakout levels are marked on chart
Use position sizing according to your stop loss level.
Like this idea if you find it helpful and please share it with your friends.
Keep learning,
Happy trading.
Thank you.

NIFTY Weekly Volatility Analysis 9-13 Jan 2023 NIFTY Weekly Volatility Analysis 9-13 Jan 2023
We can see that currently the implied volatility for this week is 2.08%
With this in mind, currently from ATR point of view we are located in the 53th percentile.
Based on this, we can expect that the current weekly candles ( from open to close ) are going to between:
*For calculations, I am using the data since 2022*
Bullish: 1.83% movement
Bearish: 1.55% movement
At the same time, with this data, we can make a top/bot channel which is going to contain inside the movement of this asset,
meaning that there is a 24.2% that our close of the weekly candle of this asset is going to be either above/below the next channel:
TOP: 18325
BOT: 17584
Taking into consideration the previous weekly high/low, currently for this candle there is :
31.43% probability we are going to touch previous weekly high
66.58% probability we are going to touch previous weekly low
Lastly, from the technical analysis point of view, currently from
Daily timeframe indicates -26.67% BEARISH trend from the moving averages index
Weekly timeframe indicates 66.67% BULLISH trend from the moving averages index
Monthly timeframe indicates 80% BULLISH trend from the moving averages index

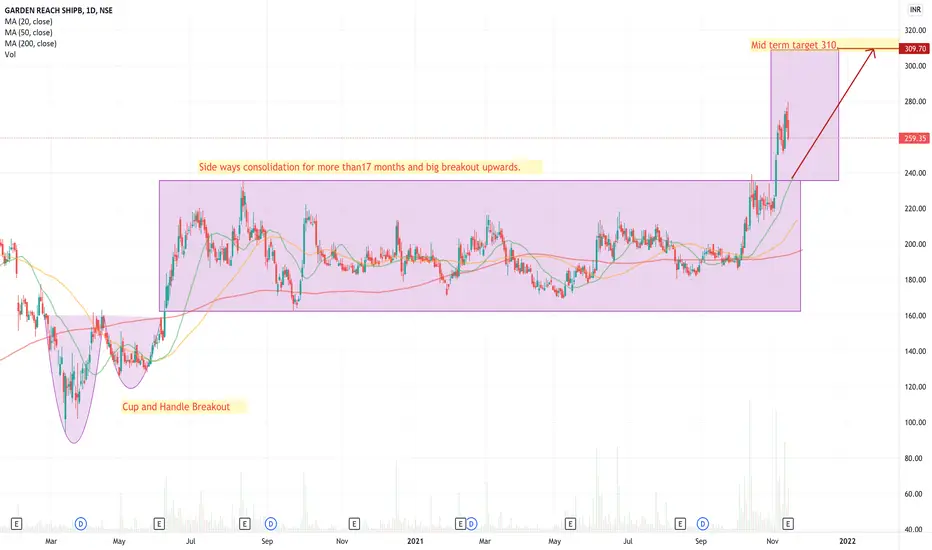
Garden Reach Shipyward - Longterm Bullish TrendGRSE had a good cup and handle breakout. Then consolidated side ways for more than 17 months and gave a breakout again recently. Generally longer consolidations results in explosive movements upwards or downwards depending on the upward or downward breakout. Mid term target 310 and long term 500 in 12- 18 months.
India Cements - Short - Target 231 , 209India cements has hit couple of key resistance levels, expect short term pullback to 231 and might touch 209. This is technical pullback , stock is still in long term bullish mode.

NIFTYThis may be in the works for NIFTY ETF .. was put to my attention by a friend.
20k may be imminent . that 17k retest (1.618) was beautiful if taken as support previously.

GAIL Gail is that Stock which is in UP- Trend 📈 and it is also going with 44 Moving Avg. Upwards. So the target 🎯 price of GAIL should be : 102 .
Note : This is just for Backtesting Purpose or Educational purpose so try at your own risk.

Nifty crash is not far away now.NSE:NIFTY
very high chance of this happening. Many temporary reasons have passed away to keep the market in a bull run, but the bears have a lot to ride down the market.
we cannot ignore the recession and lockdowns.

Indus Towers: Getting Squeezed by Mota BhaiZero Pricing Power and consolidation by large players.
Target 158 !!

NIFTY50 Weekly Volatility Analysis 12-16 Dec 2022NIFTY50 Weekly Volatility Analysis 12-16 Dec 2022
We can see that currently the implied volatility for this week is around 1.87%, equal to 1.87% last week according to DVOL data
With this in mind, currently from ATR point of view we are located in the 23rd percentile,
while according to INDIA VIX, we are on 8th percentile.
Based on this, we can expect that the current weekly candles ( from open to close ) are going to between:
Bullish: 1.8% movement
Bearish: 1.55% movement
At the same time, with this data, we can make a top/bot channel which is going to contain inside the movement of this asset,
meaning that there is a 24.2% that our close of the weekly candle of this asset is going to be either above/below the next channel:
TOP: 18740
BOT: 18060
Taking into consideration the previous weekly high/low, currently for this candle there is :
30% probability we are going to touch previous high 18740
66% probability we are going to touch previous low 18407 (already hit)
Lastly, from the technical analysis point of view, currently from
Weekly timeframe indicates 80% BULLISH trend from the moving averages index
Daily timeframe indicates 40% BULLISH trend from the moving averages index
4H timeframe indicates 13% BEARISH trend from the moving averages index

The big silver move into 2023Lots of interest in silver again with just a few weeks left of 2022.
some interesting news about India's demand and COMEX, go check it out.
pull back to support S1 or S2 (extreme), then upwards to break yearly highs and possibly more!
watch the news, that's when u will look to sell x
merry xmas and happy new year

NIFTY Weekly Volatility Analysis 5-9 Dec 2022 NIFTY Weekly Volatility Analysis 5-9 Dec 2022
We can see that currently the implied volatility for this week is around 1.87%, down from 1.9% last week according to INDIA VIX data
With this in mind, currently from ATR point of view we are located in the 3rd percentile, while according to INDIA VIX, we are on 8th percentile.
Based on this, we can expect that the current weekly candles ( from open to close ) are going to between:
Bullish: 1.85% movement
Bearish: 1.5% movement
At the same time, with this data, we can make a top/bot channel which is going to contain inside the movement of this asset,
meaning that there is a 24.3% that our close of the weekly candle of this asset is going to be either above/below the next channel:
TOP: 19070
BOT: 18370
Taking into consideration the previous weekly high/low, currently for this candle there is :
78% probability we are going to touch previous high of 18914
26% probability we are going to touch previous low of 18370
Lastly, from the technical analysis point of view, currently from
Weekly timeframe indicates 80% bullish trend
Daily timeframe indicates 80% bullish trend
4H timeframe indicates 53.3% bullish trend

UPL Trendline BrokenUPL is falling for last one month now it has showed some strength.
Trendline has broken
In option chain for 24th nov there is volume in call side.
There is one block deal purchase on 8th aug in this stock whose sell deal is not there in block deals so we can assume that postion is still open

Breakout in india cements Breakout in india cement at the levels of 248 buy at current levels for the targets of 270 stock is above of all the important exponential moving averages keep stoploss strict.

Breakout in abbott indiaBreakout in abbott india at the levels of 18000-18200 stock is above of the 200ema it may test its all time high buy at current levels for the targets above 22000.

Nykaa...or Khalnykaaa50% drop since IPO.
High time SEBI Board should be fired.
bunch of nincompoops.

NIFTY Volatility Analysis 21-25 Nov 2022 NIFTY Volatility Analysis 21-25 Nov 2022
We can see that currently the implied volatility for this week is around 2%, according to INDIA VIX data
(INDIA Volatility Index )
With this in mind, currently from ATR point of view we are located in the 11th percentile, while according to INDIA VIX, we are on 2th percentile.
Based on this, we can expect that the current weekly candles ( from open to close ) are going to between:
Bullish: 1.89% movement
Bearish: 1.5% movement
At the same time, with this data, we can make a top/bot channel which is going to contain inside the movement of this asset,
meaning that there is a 21.1% that our close of the weekly candle of this asset is going to be either above/below the next channel:
TOP: 18610
BOT: 17882
Taking into consideration the previous weekly high/low, currently for this candle there is :
66% probability we are going to touch previous low of 18220(already hit)
31% probability we are going to touch previous high of 18460
Lastly, from the technical analysis point of view, currently 80% of the weekly moving averages are in a bullish trend, and
a combination of moving averages and oscillators are in 31% bullish stance

Ultratech cement Breakout of reverse head and shoulder a stock is ready for the breakout of reverse head and shoulder pattern on the charts of ultratech cement. And there is a huge buildup near the neckline area. Buy Between 6900-7000 and keep a stoploss of 6650 for the targets of 8000-8200.This stock is above all the important exponential moving averages.

Bulls Entering into CoforgeCoforge coming out of the range is a sign of entering the bulls. Having a bullish bias on IT pack

Indian Market Bullish RALLY coming soon? Approaching a significant level, with the way India's Economy is heading, perhaps we see penetration of resistance and on to new levels.

Breakout in LT Infotech Breakout in LT Infotech on weekly charts of the w-pattern stock is above 200 days above moving average now it is ready for 5500.
Buy in the zones of 5000-5100 with stop loss of 4940 .

State Bank of IndiaHi guys, In this chart i Found a Supply Zone in SBI for Shorting, Observed these Levels based on price action and Demand & Supply. Don't Take any trades based on this Picture ...because this chart is for educational purpose only not for Buy or Sell Recommendation.. Thank Q

