India


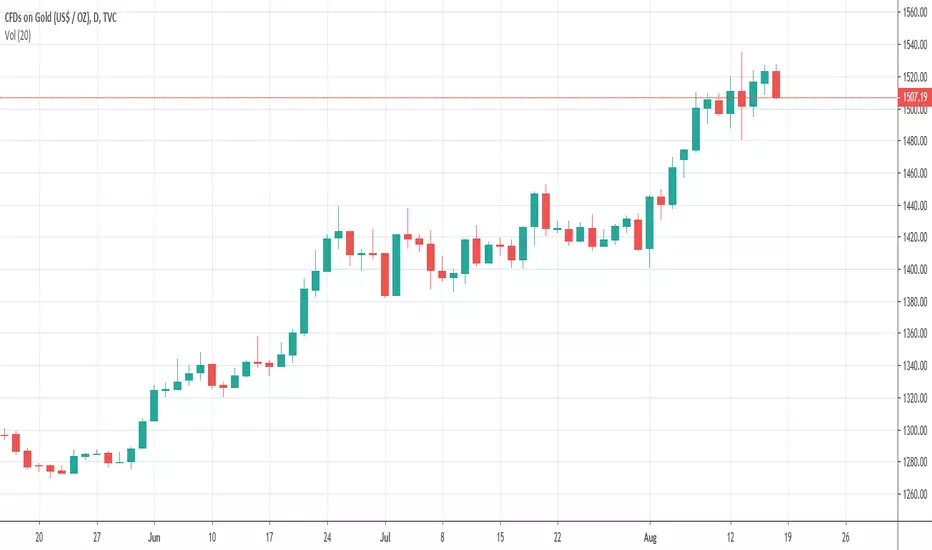
Indian gold marketGold prices increased on Friday. The price of spot gold increased by 0.2% to $1.525 per ounce. It is an exciting fact that gold prices increased by 2% this week. Also, another good news for investors is that gold prices are rising for a third week in a row. U.S. gold futures increased by 0.3% to $1,535 an ounce.
Higher gold prices boosted the demand for this precious metal in India. It is worth mentioning that India is the second biggest gold consumer in the world. Based on the latest data, gold imports decreased by 42% to $1.71 billion in July.
According to the local jewelers, the supply of the scrap gold increased as costumers are willing to sell them due to the higher prices. Another reason is that the national currency’s exchange rate also helped to drive the gold prices higher in India. The price of rupee fell below 71.21 against the U.S. dollar.
More @ Finance Brokerage
2.5R Trade on Ajanta Pharma. 42% upside possiblityBreak of Trendline which has been haunting Ajanta Pharma for 3 years (since 2016).

USD/JPY in the rise.With crossing of 200 SMA and strong support of past bars. Another big upside is expected.

EUR/USD - Short ProbablityWith 1000 SMA Cloud on top, and multiple failure to break it a big downside move is anticipated.

BTC/USD - 1H RiseWith 1000 SMA on the support side, Its' Strong Support. Taking decision around there would be a good Idea.


Nifty 50 Weekly ChartLet's see where we are going to head from here, as all major Supports broken with heavy Volume.

ENGINEERS INDIA LIMITED FOR THE LAST 1 HOUR BULL ARE IN CONTROL OF THIS SHARE .....TAKE AN ENTRY AT107 AND KEEP THE STOPLOSS AT 95 WITH A TARGET OF 115+ FOR 1-2 WEEK ................................SWNGG IT SWINGGIT SWINNNNG IT

LTCUSD - & Yes... I'm Holding To my Crypto Sept 28 Bottom DateLTCUSD - & Yes... I'm Holding To my Crypto Sept 28 Bottom Date

Divis Laboratories Ltd Technical Analysis Indian Stocks MarketDivis Laboratories Ltd Technical Analysis Indian Stocks Market

India SENSEX daily, bearish wedgeThe Indian index SENSEX was forming a bearish wedge on its daily candlestick, waiting it to break below the line, short term target is 38,000.

As expected Seller-Pressure seenThis is only post for information, not for trade.
I have mentioned the support which may react.

Investors and Swining Trader opportunity.Everything is in plotted in the chart but, where should be our entry will decide by lower timeFrame chart.
WAIT and LET ME UPDATE very soon lower time chart for exact entry level.

Chinese white paper, India in cross-hairs & Bank of Australia
China releases white paper, India in the crosshairs, Bank of Australia decision
China has maintained a paused after the US showed trade aggression, apparently, hoping to reach an agreement. Apparently, hopes were not justified. As a result, the so-called “White Paper” was born. The document, which sets out the position of China in order to negotiations with the United States on trade and economic issues. The main message is the following: China does not want a trade war with the United States, but will not avoid it if it is needed. Also, China quite clearly set forth its terms for a deal with the United States: the USA cancelling all duties on goods imported from China.
In addition, China is gradually starting to counterattack. For instance, the investigation began against FedEx Corp. the other day. Huawei accused FedEx of sending two parcels with important commercial documents to the United States. According to the results of the investigations, FedEx Corp. may fall into the list of unreliable companies.
Meanwhile, Trump is planning to open another front of the trade war - the Indian one. From June 5, the States may deprive India of the status of a country with a developing economy, which will exclude the possibility of duty-free export to the United States of more than 2,000 Indian goods.
In general, everything is bad. Morgan Stanley analysts have warned about this that further growth in trade tensions may lead to negative US economic growth as early as Q3 2019. Therefore, our recommendations are: buying safe-haven assets (gold and Japanese yen) and selling the dollar.
From the events of today, it is worth noting the Reserve Bank of Australia meeting, at which the Central Bank lowered the rate by 0.25%. This is definitely a bearish signal for the Australian dollar. Given the intensification of the trade war, while AUDUSD is below 0.70, we recommend looking for points for selling of AUDUSD on the intraday basis and the medium-term directions.
Our positions for today: we are continuing to look for points for buying of the euro and the pound against the US dollar, sales of oil and the Russian ruble, as well as buying of gold and the Japanese yen. In addition, we will buy the Canadian dollar against the US dollar.

TARIFF MAN TO STRIKE GLOBALLY!This is a 6H chart of the DAX. Markets globally are heading south. Even the super-resilient Brazilian Bovespa is beginning to buckle. In this screencast I show what the price action is like for the DAX and why I think the market is exhausting. I may well be totally wrong - but I'll limit how wrong I am with an acceptable stop-loss.
Three main issues plague the DAX and other markets globally:
1. China trade/technology war.
2. Tariff man picking a fight with Mexico
3. And as of a couple days ago Tariff man has squeezed India by ending special trade treatment. (Google is your friend on that one).
From what I see, the house of cards, the Ponzi scheme that is global markets is falling. I'll take my losses in shorting these.
Disclaimer : This is not a recommendation to trade. Opinions here are my own. If you make decisions based on this and you lose your money sue yourself!

TCS testing high of Sep 18?TCS again rallying up to its high to test May 19 and Sep 18. Expect high volume on that level which might give a dip.
Enter with confirmations. Might prove it to be a good intraday trade or can be a long term with good reward if HOLD.


ZEE entertainment possible buy ?ZEEL has been in a downtrend following trend line. It is near to FEB'19 low. hopefully looking for a buy from 330 on support.
Earning data on 27 will be in key focus.

YESBANK:NSE Possible buy from 125-30 range.Yesbank has been struggling with the bears from poor results. Seems like a good gains from range of 125-30. (Aiming for 300-310 if hold on technicals).
current rend - Downtrend/bearish
RSI oversold on till daily charts.
Consider fundamentals and enter with confirmations.

GOLD (XAU/USD) 4-HOUR TIMEFRAME SHORTPrice is currently moving downwards, making a series of impulses, corrections and continuations. Therefore, bear flag patterns are written all over Gold's wall. I will expect to take a short position once prices breakout of the bear flag pattern and target the 1270 price level.
If prices can break below the 1280 level and push to the downside, it could be a good indication of bearish momentum. As always, let the market reveal its hand and wait for a collapse below entering any short positions. This is because market makers will be looking to trap breakout traders (particularly those waiting to place a short position). Otherwise, only market wizards can forecast the market direction.
