NIFTY : Time To Short Towards 10000.Amid all the Election noise, Worlds biggest democracy has set poll date to 23rd may 2019 and will decide the future of PM Modi. I tend to believe that NIFTY will be in sharp correction of C and will continue towards secular bull upside printing iv of (3) of 5 in EW. So for next weeks looks for sell setups and trade towards.
Jai Garvi Gujarat.
Jai Hind.
Robus.
India

Holding above Weekly t-line pushing higher every week BULLISHGood volume in this stock as of late & something to keep an eye on.
I can see this spike on next news on the final project approval by government
Got a good feeling that it could happen in April.
Price continues to hold the 20ma & closed above weekly t-line
37-40p target for 1st slice although it could go higher with right news possibly 68p as last time a few weeks ago.


India Bulls Housing LongIndia Bulls Housing Trades using Blue Sky Plus Indicator. Message or Comment to get a free trial of the indicator.

HDFC Bank Possible long opportunityTaking Support on Weekly and Daily trendline. With the possible target of 2100.

Possible short opportunityReaching Monthly Trendline 1270.40 possibility of going short, entry on retest.

NIFTY: MAKE YOUR MIND UP TIMEWe are close to "make your mind up time" in NIFTY 50. Are you a right shoulder? Or are you the start of a new bull trend. If you're a right shoulder, we are close to the sweet spot for a short. Stoch RSI is overbought, curling over, 21 MA is down.
I will initiate short positions next week on a reaction high.

NIFTY 50 SHORTMoving average deathcross.
Strong 100 day MA rejecc.
potential right shoulder forming.


Indian Stock Market Outlook for 2018 The two-year bull run of Indian stock market since March 2016 is due for a breather. Sensex touched a new all-time high of 36443 on January 29, 2018, ushering new euphoria amongst people. Markets do not go straight up or down, they do so in steps. We are expecting a step-down 2018 for 90% of Indian equities. And we do not expect the new highs to be taken out for the better half of 2019.The reason for a bearish outlook for Indian markets for us is purely technical. We do not try to link fundamentals with our reason so as to appease the economists. What this means for an average investor is to either sit on cash or be very stock specific. Following the broader markets – it’s going to be very hard to generate a positive return on investment this year. How deep the correction is going to be will become clearer when the market makes a few lower lows and lower highs.
We, on this blog, are trying to bring you information and ideas to create wealth amidst all odds. Our investment philosophy is to be in the know of events unfolding that lead to changes either positive or negative – come out as a winner, regardless. Keep coming back to this blog to know what we have our eyes on. We will give you plenty of stock ideas so as to make your year a fruitful one.

Elliott Wave View favoring more upside in NIFTYHello Traders,
NIFTY is showing an incomplete sequence to the upside in the short term, favoring more upside while above 11/26 low (10487.1). Near term, cycle from 10/26 low (10004) remains in progress as a zigzag Elliott Wave structure. Blue Wave (A) ended at 10774.7 as 5 waves impulse Elliott Wave structure and blue wave (B) ended at 10487.13 low.
Blue of wave (A) unfolded as an impulse where red wave 1 ended at 10285.1, red wave 2 ended at 10105.10, red wave 3 ended at 10619.55, Red wave 4 ended at 10440.55, and red wave 5 of (A) ended at 10774.7. Blue wave (B) pullback unfolded as a double three Elliott Wave structure where red wave W ended at 10562.35, red wave X ended at 10646.25 and red wave Y of (B) ended at 10487.13.
Up from 10487.13 low, blue wave (C) is in progress as a 5 waves impulse Elliott Wave structure where red wave 1 ended at 10941.20 and red wave 2 pullback is proposed to be completed at 10831 and ideally should extend higher as long as it stays above that level but more importantly above 10487.13 low. We don’t like selling it as the right side is to the upside.


NIFTY 50 Looking to Consolidate Soon For those that are following this market and are invested into this index, it looks like there is some consolidation that we can expect in the very near future at some point.
The Indian markets are not immune to the same thrusts, ebbs & flows of the general markets.
As of right now, the DJI is currently getting pounded and so is the SPY as well as any other indices that is tracking European + U.S. stocks currently.
Conversely, the NIFTY 50, NIKKEI and other Asian indices are doing well. Potentially because of dollar flight into those markets.
However, one fundamental key that investors should be remain cautious of is the excessive debt incurred by the Indian government. Recently, the Indian government replaced the board of Infrastructure Leasing & Financial Services; a move that could greatly reduce foreign investment and reduce overall faith in India's sustenance over the long-term.
The financial outlook for India has persistently looked bleaker on a month over month basis for a while, but few have seriously paid attention. The tip over of the Indian markets could cascade into other markets in the East and eventually have a global impact.
This is worth seriously monitoring.

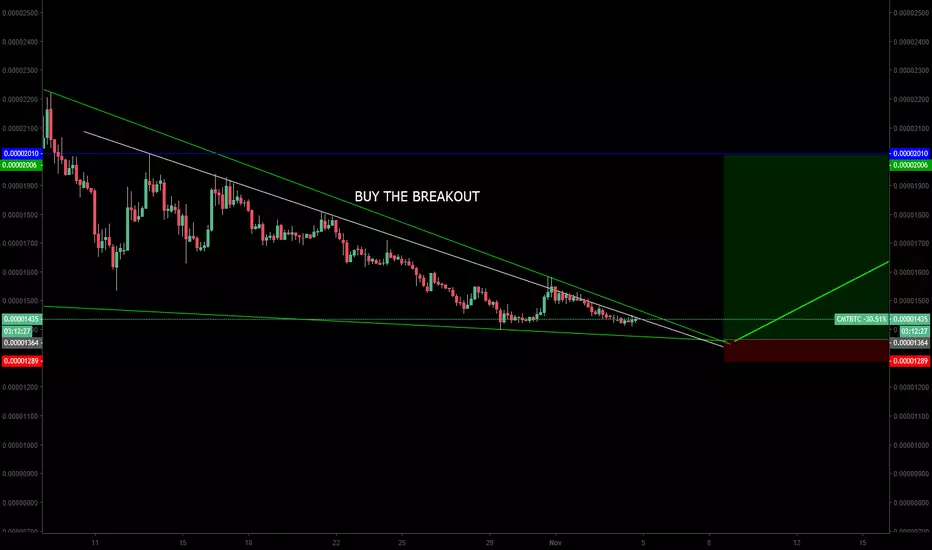
$cmt and its struggle to breakout.CMT has been accumulating for long time now and should breakout in coming week.
open a position only after it breaksout.
Do share your opinion about my analysis and hit a like if you agree with my thoughts.
Trade and Mindset Failure Analysis.Everyone has bad days in trading - I usually never let my mind get affected. This was different, because like an amateur, I panicked out of a set of trades because one went bad.
I was in three trades simultaneously-
1. Short on a put option for 9000 strike = Would have worked out if I gave it time
2. Bought Tata motors - trade premise inconsistent and circled back to market conditions = Would have been a break even trade - why was I trading the stock anyway, it was neither my speciality nor an immediate need. Maybe I was uncomfortable with my exposure
3. Long on a call option = Would have worked out if my goal was different (instead of covering a loss from the above two trades, I should have treated it as an independent event)
The timeline of events is as above.
Learnings:
1. Stick to Futures, Options and Indices. I am not a stock trader - I trade derivatives which I'm good at. Lack of volatility made me skittish and I panicked.
2. I'm watching too many TV series and not working hard enough. That changes today. I am working out every day which is becoming the second good thing I do - I used to have more and I'm going to work harder to get back to that.
3. Too many things on my mind - its time to close everything outside of trading that's pending - immediately, make a to-do and strictly stick to it
4. No more gaming on weekdays, its messing with my hardwork mindset.
Other affecting factors:
1. Bitcoin is not moving. I'm hedged but its an opportunity cost that gets heavier as time goes by.
Okay - that's out of my system. Back to work.

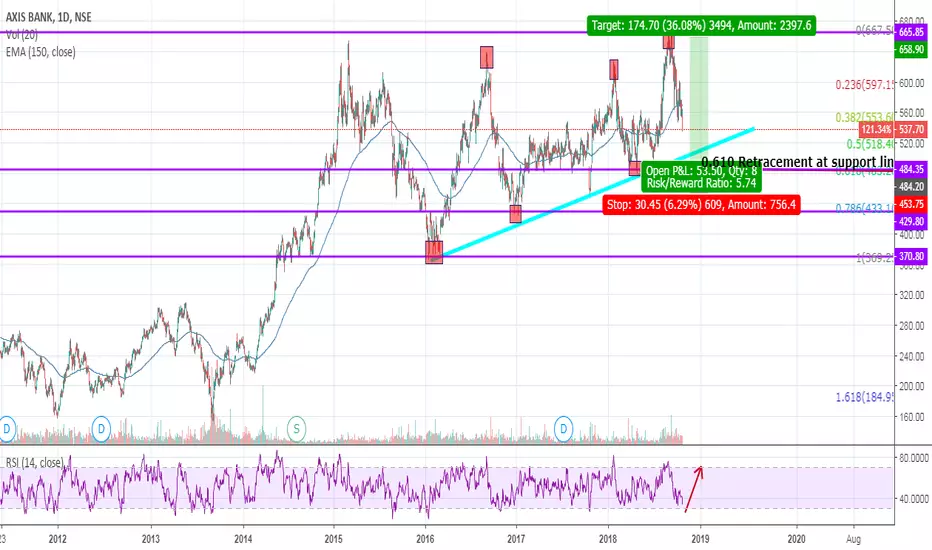
BUY AXIS BANK |||STOCK MARKET CRASH/// AS AXIS BANK IN STORT TERM DOWNTREND AND LONG TERM UPTREND
BUY AFTER 0.618 RETRACEMENT AT SUPPLY ZONE
BUY AT ----------484.40
STOPLOSS------- 453.00
TAKE PROFIT ----666.00
AS UNITED STATE TRADE WAR THE WORLD MARKETS CRASH AND INDIAN MARKET WILL RECOVER ITS STRENGTH BACK AFTER FEW WEEKS
FOR FREE INTRADAY SIGNALS AND FOR MORE DETAILS
NAME :GOKUL
CONTACT +919677152635
EMAIL------gokularyaa@gmail.com
(FOREX,EQUITY,COMMODITIES)

STOCK MARKET CRASH||||||AXIS BANK DOWN TREND GOING TO END !!!!!!STOCK MARKET CRASH CRISIS DUE TO US TRADE WAR WILL END SOON..
AS AXIS BANK IN SHORT TERM DOWN TREND--LONG TERM UP TREND
BUY AXIS BANK AT 484.85 STOP LOSS AT 453.00 TAKE PROFIT 666.00
FOR FREE INTRADAY SIGNALS CONTACT:
WHATSAPP +919677152635
EMAIL:gokularyaa@gmail.com


Nifty 50 will touch EMA 100 and ReboundElse it will go below EMA 100 to touch EMA 200 Around 9600 mark

