India
INDIA SWING TRADE
India is bouncing at a key market level today. Aggressive traders can get long immediately. Patient traders can watch for a signal next week. These emerging markets gap a lot and often leave traders wondering what is happening. Trend analysis and risk management makes our life a lot easier here.

SGDINR - More Upside in the Near / Medium TermWas in a discussion with one of our students from India asking about how's the outlook on Singapore Dollar (SGD) against Indian Rupee (INR).
Thought would be good to share our outlook for those who are looking at this two currencies as well.
My personal bias is that there is still more upside potential on this pair - meaning we can still expect to see some strength in the Singapore Dollar against the Indian Rupee in the near term, potentially towards 48.54 - 48.98 area.

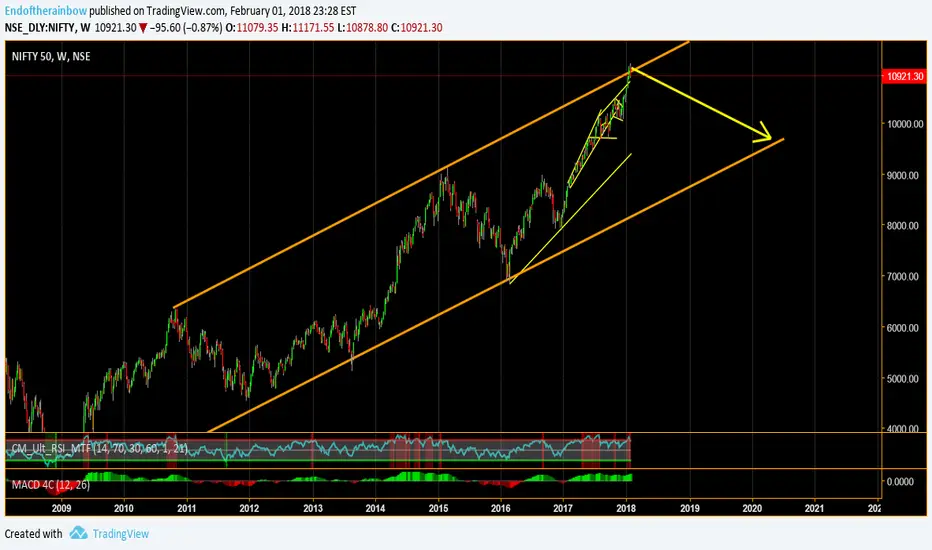
ACC NSE Nifty Short ideaPrevious supply zone intact and is pushing the prices down.
Alternate Trading plan is to wait till the price drops and WRITE 1500 PE Puts.


INFRATEL broke inverted H&S necklineThis stock was in falling channel from 2015 before finally turning the trend after bottom in early this year, after price broke out of the falling channel of two years stock price started inverted H&S pattern. This week's closing candle closed above the neckline briefly and setting the target to 490 level to the upside from current level of 404 per share. This is good setup with decent risk reward ratio if taken now.

Nifty near ResistanceThe Nifty is close to a major resistance area between 9.695 - 9.710. Last up move from 9.450 until now is getting exhausted. So we have a good chance for a pullback within the first touch of resistance!

POSITIONAL LONG EIHOTELEI HOTEL ACTUALLY HAD A GREAT RUN FROM 102 LEVELS. AFTER THAT THERE HAS BEEN IN A CONSOLIDATION OR RANGEBOUND PHASE IN THE PAST MONTH OR SO. TODAY IT BROKE OUT WITH VOLUME IF YOU SEE THE CHART. RSI IS ALL SET TO GO ABOVE 70.
IM BUYING AT CURRENT LEVELS OF 139.70-140 AND ABOVE WITH A STOP OF AROUND 130 LEVELS.
TARGET WILL BE ABOVE 170 LEVELS . IL BE TRAILING MY STOPS AS THE STOCK GOES UP.

INTRADAY DIVISLAB SHORTDIVISLAB IS SHORT BELOW 623 WITH A STOP LOSS AT AROUND THE HIGH OF THE CANDLE WHICH BREAKS THE IMPORTANT SUPPORT LEVEL.
TARGET CAN BE AROUND 620-618.
ALL THREE CONDITIONS WHICH I SEE ARE IN PLAY.
VOLUME IS HIGH
RSI BELOW 30
PRICE IS NEAR SUPPORT LEVELS AND IN DOWN TREND.

Weekly Perspective (Ozzie Canadian Dollar)Hey Guys,
The pair heads its way towards the north with a strong bullish engulfing candle inside the channel reverses the downside risk. Softer AU CPI adds to softer commodity export prices and weighs on AUD,limiting any rebounds.RBA policy remaining on hold for a prolonged period is also underscored by low core inflation.Recent CAD weakness may turn as Trump’s focus turns from tinkering with trade tariffs to focusing on tax reforms without Border Tax Adjustment.Oil may stabilise as OPEC arrange to meet to discuss extending production cuts.
Note: Everything works with Best money management.
Note: Please leave comments for any query.
Disclaimer: Trade at your own risk.
Good Luck...!!
Regards,
Growing Forex Team

Weekly Perspective (Euro Ozzies)Hey Guys,
The pair is currently in the strong move towards the north. The pair posted a 18 months low and reversed the surge towards north.It also broke the 18 months trend line that released the downside pressure the pair was facing.Due to the political uncertainty and the French Election that supported the Euro was the major reason behind the break of the 18 months trend line after that it formed a continuation pattern.It is more likely this pair will form many continuation on its way up.There can be a dip in the coming days and that would be the entry for those who missed the opportunity to enter.
Note: Everything works with Best money management.
Note: Please leave comments for any query.
Disclaimer: Trade at your own risk.
Good Luck...!!
Regards,
Growing Forex Team

Weekly Perspective (Ozzie Kiwi)Hey Guys,
If you reviewed my previous ideas by know you know the correlation in the pairs.As you know we are looking for a breakout on the way up in AUDUSD and we know that the kiwi is going to be strong in the coming days. Technical the pair has completed its move southwards and is headed north so i'm looking for continuation patterns to enter every time they form or to move the stop losses if you have any.The previous week was a strong one for AUDNZD but the correlation was different the ozzies were weak the kiwi was weak the pair of AUDNZD was more likely going to fall but the perspective changed the whole idea now we have something different in our charts show us that the downside pressure will be easily diminished as soon as the price crosses the previous high.
Note: Everything works with Best money management.
Note: Please leave comments for any query.
Disclaimer: Trade at your own risk.
Good Luck...!!
Regards,
Growing Forex Team

Weekly Perspective (Cable) Hey Guys,
The Cable likely to extend its bullish momentum on GDP figures.It has been rising from Mid March & soon you guys will see an exhaustion on this pair make sure we are ready to grab valuable pips.The pair major continued scaling higher and refreshed multi-month highs. Spot prices held above the 1.2900 handle as traders now look forward to the first estimate of the UK GDP growth figures for Q1 2017.As the reading is negative upside risk is minimum but the pair can refresh multi months low in the year ahead.
Technically, the pair seems to have confirmed a fresh break out and is trading above a strong hurdle, marked by 61.8% Fibonacci etracement level of 1.3445-1.1980 Down slide.On the flip side, immediate retracement below 1.2885 level might now find some fresh buying interest at a previous resistance, now turned support, near 1.2860-50 zone. Weakness below this immediate support levels might prompt additional profit taking and drag the pair back towards the 1.2800 handle, which if broken might impugn near-term bullish bias.
Note: Everything works with Best money management.
Note: Please leave comments for any query.
Disclaimer: Trade at your own risk.
Good Luck...!!
Regards,
Growing Forex Team

Weekly Perspective (Euro Canadian Dollar)Hey Guys,
The pair is currently trading higher with a gap towards the south that may be the major risk factor in the coming weeks.The question is will it fill the gap or it will just continue to rise ?.After a continuation pattern the pair posted some modest gains and is headed towards north.Moreover the French election would be a boast to the Euro or it can be the worst nightmare.By looking at the current trend and the bias,there are no signs of any bears at all it is purely bullish.
Note: Everything works with Best money management.
Note: Please leave comments for any query.
Disclaimer: Trade at your own risk.
Good Luck...!!
Regards,
Growing Forex Team

Weekly Perspective (Kiwi)Hey Guys,
The kiwi reverses its gains, Having posted a session high near 0.6890 region, the NZD/USD pair ran through some fresh offers and drifted into negative territory for the fifth consecutive session.The pair extended its bearish slide through the course of current trading week and is now headed back to nearly 10-month lows touched in the previous session, despite of the frequent negative sentiment surrounding the greenback.In fact, the key US Dollar Index has now dropped back closer to 5-month lows touched earlier this week and hence, the latest leg of the pair's downfall in the past hour or so could be solely attributed to rising treasury bond yields, which tends to drive flows away from higher-yielding currencies - like the Kiwi.
Technical levels to watch : A follow through weakness below yearly lows support near 0.6850 level is likely to get extended towards testing the 0.6800 handle ahead of 0.6775 horizontal support.On the flip side, any recovery attempts beyond the 0.6900 handle, leading to a subsequent move above 0.6920 level, is likely to trigger a short-covering rally even beyond near mid-0.6900s back towards the key 0.70 psychological mark.
Note: Everything works with Best money management.
Note: Please leave comments for any query.
Disclaimer: Trade at your own risk.
Good Luck...!!
Regards,
Growing Forex Team

Weekly Perspective (Guppy)Hey Guys,
GBP/JPY continues sharp breakout flow on Thursday to hit its highest level since early-February, extending the sharp breakout move that has been in place for more than a week. This breakout was initiated last week on April 18th, after UK Prime Minister Theresa May called for a snap election to be held in June.This political move was undertaken so that May could secure a solid mandate to deal with difficult negotiations with the European Union as she sees fit, amid the ongoing formal process of UK/EU separation. The pound rose sharply on that announcement due in large part to the fact that May’s Conservative Party remains far ahead of the Labour Party in polling. This would then promote greater stability for both the UK and its currency.As the pound has continued to rise in a relief rally, the safe-haven Japanese yen has fallen sharply for more than a week as a strong, risk-on environment has taken hold of the markets. This has especially been the case after this past weekend’s first round of the French presidential election, which showed the market-friendlier Emmanuel Macron gain increasing support over his far-right rival, Marine Le Pen.During Declining Brexit concern that has alleviated pressure on the pound, as well as decreased risk aversion in the markets that has reduced demand for the yen, GBP/JPY has correspondingly been boosted sharply to break out well above a key downtrend line extending back to December’s 148.00-area high. This surge has been sustained up to Thursday and could continue to drive GBP/JPY higher, barring any UK political surprises or major market-disrupting events on a global basis. The next key upside resistance level is around the 145.00 area. With any further breakout above 145.00, GBP/JPY could once again begin to target the critical 148.00 resistance objective.
Note: Everything works with Best money management.
Note: Please leave comments for any query.
Disclaimer: Trade at your own risk.
Good Luck...!!
Regards,
Growing Forex Team


HEROMOTOCORP : SELL SIGNAL To Rs 2598 and Rs 2266Supreme Court bans BS 3 vehicles models for sale and Hero has inventory of 3.5 Lakhs to get rid off.
This will prove as Catalyst for EW to finish its pending C wave.

Strategy for one of the best Indian banksHopefully we see $35 on this one. This company will likely be an absolute monster in the future.

HKDINR @ daily @ currently less than 1% udner all-time highsThis is only a trading capability - no recommendation !!!
Buying/Selling or even only watching is always your own responsibility ...
.zip (with PDF`s) @ my Google Drive
In percents away from all-time high & low by last close (1482 Cross-Rates)
drive.google.com
Best regards :)
Aaron

Banknifty to 19kFII Sentiment changing, correlation between DOW and Indian markets coming towards positive after hovering over -80%+. Support line is a 2 year strong support line, domestic news catalyst is in. Stop at 17.55 TP at 19k.
Anything can happen trade on your own discretion.


IDEA Correction Potentially Over.. Buying Opportunity!!IDEA has been correcting since a long time and it looks like the correction is Potentially Over.. I am taking an Early Action on it with a small stoploss around 63 levels and Targets around 120. There is Bullish MACD Divergence on the chart and the last candle is bullish one to give some support for the prediction.
Happy Trading!!
