INDIA WAVE B OR 2 TOP EXIT NOW !!The Chart posted is the nifty 50 India market .I am now turning Bearish As we seem to be ending my alt Wave count for wave C up in the ABC rally . We are now at HIGH RISK if this turns Down . Best of Trades WAVETIMER
Indianmarket

NIFTY 50 4hr analysis (bullish) (16/04/2025)Welcome back folks
havent been posting lately because of the hectic schedule,
the analysis is based majorly on the current emotions of the speculators that is relief bullish rally
- possible gap up tomorrow, if market makers decide to book profits tomorrow then its blood bath again imo
- either a follow up range or breakout above marked figures in the chart is expected
- i personally believe to not overthink this and be a part of the crowd and hope for the latter
trade cautiously, i wont be posting index charts anytime soon now, only stocks if schedule allows me
feel free to chat with me in the comments

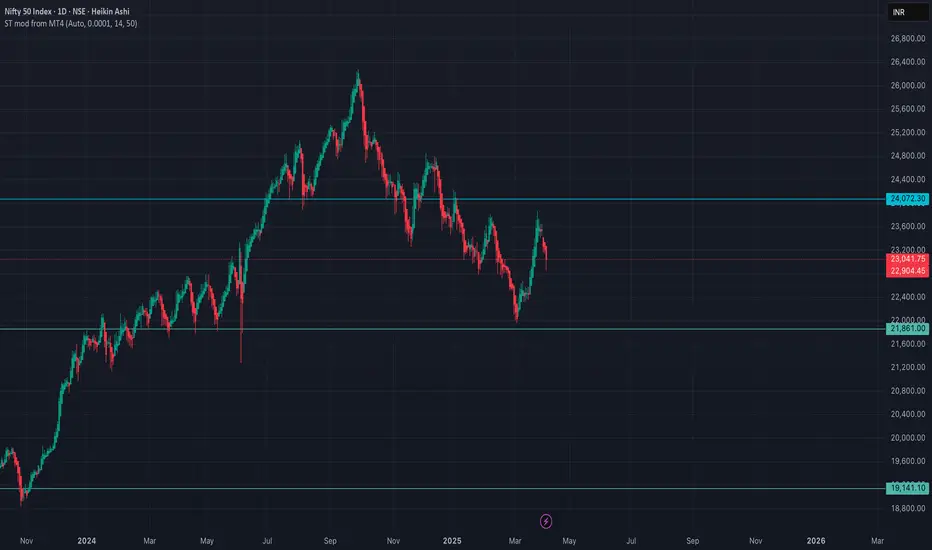
levels to watch It's clear that analysts, the media, and others who seek the spotlight often try to explain why the markets moved in a certain direction. The irony, however, is that these explanations usually come after the market has already moved, making it obvious that they’re just linking the moves to some news event.
If you pay close attention, you'll realize that technical tools can provide valuable insights ahead of time, helping you predict how the market will behave and where it’s likely headed. For those who’ve read my past articles, you’ll notice I’ve already highlighted key levels for the Nifty index and the potential targets it could reach.
Whether there were tariffs or not, the market was bound to drop. But as I pointed out, the crash is being blamed on the tariffs.
As long as the markets remain below the 24,000 level, we can expect them to target 21,800 and possibly even lower in the coming weeks.
I had booked profits for some of my stocks around the 21,800 level and re-entered short positions at 23,800.
BankNifty Technical analysis - Mar 3 2025RED UMVD flashed warning sign back in Oct. I hope some of you were able to use this signal to cash out.
Bars are red and we are approaching immediate support again, lets see how it handles.
As long as UMVD is Red , I wouldn't buy. TrapZone has thinned now and market will most likely get volatile and sideways, unless we enter another wave of selloff. In that case we will see Red TrapZone and all hell will break. lol
will post an hourly for short term players.

Correction Done?? Some Green candles coming. Here is a quick update.
Watch out this graph. here are few points which is clearly highlighting some upcoming moves in Nifty.
1. Weekly MA 100 is on point to support.
2. as per volume traded, 22000 is strong support.
3. Yellow trend line showing weekly movement. giving hope for some recovery in upcoming days.
4. Please watch out for this high volume area. if it breaks. we fall down to 21600-21000.
Please always use stop loss and trade with your knowledge.

NIFTY EASY TO UNDERSTANDNIFTY Easy to understand analysis share with you when market go down to demand zone we will see buy from that level if market go to upside then we will see sell on that level those i shared in this chart.
Remember! The Market is a Device for Transferring Money From The Impatient To The patient.

KPIT Tech- Support held, upmove in progressKPIT TECH- held the support zone perfectly well, next upmove faces resistance at zones mentioned, 0.5 FIB level is the key now.
Take gains if entered short term trades at levels.

Mangalam Cement: Profitable Long TradeTrade Overview: Mangalam Cement demonstrated a strong bullish move on the 15-minute chart, with all targets (TP1 to TP4) successfully achieved using the Risological Swing Trading Indicator . The trade capitalized on a well-timed entry near ₹919.05, with a stop loss (SL) set at ₹907.45, and hit the final target of ₹994.05, showcasing high accuracy.
Key Levels:
Entry Price: ₹919.05
Stop Loss: ₹907.45
Take Profits:
TP1: ₹933.35
TP2: ₹956.55
TP3: ₹979.75
TP4: ₹994.05
Fundamental Analysis: Recent news supports the price movement:
Strong Quarterly Earnings: Mangalam Cement reported a net profit of ₹32.8 million for the September quarter, signaling financial resilience.
Improved Profitability: The company has shown consistent growth in quarterly profits, boosting investor confidence.
Market Stats:
Current Price: ₹1,007.75 (+1.66%)
Volume: 142.78K (above average)
52-Week Range: ₹610.30 - ₹1,093.70
Mangalam Cement's robust fundamentals and the Risological Indicator's precision have once again delivered a profitable trade setup.

Nifty50 Trendline Retest – What’s Next for Traders?The Nifty50 is at a decisive point, retesting a key breakout level. Here's my take on the key levels to watch and how traders can approach the market
Nifty50 Analysis - 5th January
What's Happening?
Nifty 50 is at a make-or-break point. It recently broke out of a downward trendline, which is usually a good sign for bulls, but now the index is retesting that breakout. How it reacts at these levels will set the tone for the next move.
Key Levels to Watch:
- Resistance Zones:
- 24,222
- 24,347
- 24,528
- Support Zones:
- 23,990
- 23,897
- 23,790
- 23,592
Possible Scenarios:
1. The Bullish Path:
If Nifty holds above 24,057 and shows strength, we could see a move to 24,222, and if the momentum is strong enough, it might even test 24,347 or 24,528.
2. The Bearish Path:
If the price drops below 23,897, things could get dicey, with the index likely heading toward 23,790 and 23,592.
How to Trade This?
- For the Bulls:
Look for sustained buying above 24,057 to go long. Targets: 24,222, 24,347. Stop loss: Below 23,897.
- For the Bears:
If the price slips below 23,897, you might want to short. Targets: 23,790, 23,592. Stop loss: Above 24,057.
Final Thoughts:
This is one of those moments where patience pays off. Let Nifty show its hand before jumping in. Watch those key levels closely, and always trade with a plan (and a stop loss!).
NSE:NIFTY
Let me know your thoughts on this setup! Do you think bulls will hold, or will bears take over?

NIFTY WEEKLY ANALYSISBEARISH POSSIBILITY TRADE SETUP
Liquidity resting above to be taken out
ssl to be taken out below

Reliance Industries- YEARLY CHART- A concerning candleAfter 9 years RIL- Reliance is ending the year with -ve gains for the year! A slight concern, or a possible opportunity?

HEG Skyrockets! All Targets Nailed with RisologicalHEG on the 1-Hour timeframe successfully executed a long trade with all targets from TP1 to TP4 hit with remarkable precision.
Trade Highlights:
Entry: ₹428.35
Targets Hit:
TP1: ₹448.85
TP2: ₹482.00
TP3: ₹515.20
TP4: ₹535.70
Stop Loss: ₹411.75
Technical Insights:
This trade showcased the accuracy and reliability of the Risological Trading Indicator in identifying optimal entry points and scaling through multiple target levels. The upward trend was well-sustained, demonstrating confidence in the tool's ability to manage trades effectively.

DELHIVERY INTRADAY TARGETS DONE!Delhivery on the 15-minute timeframe delivered a stellar intraday performance, achieving all predefined targets with precision. This long trade was executed using the Risological Swing Trading Indicator , ensuring a well-timed entry and a disciplined approach.
Delhivery Key Levels:
TP1: 340.80 ✅
TP2: 346.20 ✅
TP3: 351.60 ✅
TP4: 354.90 ✅
Delhivery Technical Analysis:
The trade was initiated at an entry price of 337.45, with a stop-loss positioned at 334.75 to limit downside risk.
Delhivery exhibited strong bullish momentum, crossing the Risological trend line early in the session.
The stock maintained upward movement, achieving all take-profit levels in this intraday trade. This setup highlights the power of the Risological indicator in capturing quick and profitable opportunities in volatile markets.
All the best and do follow me for more success stories, insights, tips and profitable stock calls.
Namaste!

ITI Hits TP1! Target ₹450—Daily Chart Breakout!Indian Telephone Industries (ITI) on the daily timeframe has achieved TP1 and shows strong bullish momentum, making it highly probable to achieve TP2, TP3, and TP4. This trade was identified using the Risological Swing Trading Indicator , providing clear entry, stop-loss, and target levels.
Key Levels:
TP1: 301.40 ✅
TP2: 357.90 (Pending)
TP3: 414.40 (Pending)
TP4: 449.30 (Pending)
Technical Analysis:
The trade entry at 266.50 was confirmed with a breakout above key resistance levels, supported by bullish price action. The stop-loss is tightly placed at 238.25, ensuring risk is well managed. The current upward trajectory aligns with the Risological trend, signaling strong continuation toward the upper targets.
Traders should monitor the price action near TP2 and TP3 for any signs of consolidation or resistance, with the expectation of further upside potential.

Bank Nifty 26th Forecast | NSE | Wait for Bearish Confirmationgrabbed max buy-side lq
likely move to bearish in coming days after bearish confirmation
waiting for the bearish confirmation today
market will reach to sell-side demand zone

SAIL - Elliott Wave SAIL (Steel Authority of India). It seems to be in a running or expanded correction with currently wave 'c' ongoing. Price could test either the 50% of even 61.8% fib. level before turning bullish.

WAAREE Short Trade Targets in Play, Massive Drop to 1571!WAAREE (15m time frame), Short Trade
Entry: ₹1,763.00
Current Price: ₹1,571.00
All Targets Done!
Key Levels:
Entry: ₹1,763.00 – After confirming a strong bearish signal, short entry was executed.
Stop-Loss (SL): ₹1,767.60 – Placed above key resistance to protect against potential reversals.
Take Profit 1 (TP1): ₹1,757.30 – First target triggered, confirming downward movement.
Take Profit 2 (TP2): ₹1,748.10 – Critical support level broken.
Take Profit 3 (TP3): ₹1,738.90 – More aggressive downside level confirmed
Take Profit 4 (TP4): ₹1,733.25 – Final target hit for deep correction in this trend.
Trend Analysis:
WAAREE’s price continues to plunge after a decisive break below multiple support levels, confirming strong selling pressure. With the current price at ₹1,571, this trade has captured a significant move, with further downside potential still in play.

BankNifty 3000+ Points Profit in This MASSIVE Short TradeBankNifty 3000+ Points Profit in This MASSIVE Short Trade
Just look at this beautiful short trade.
No complex technical setup.
No small profit exits.
Neat entry, huge trade with massive 3000+ points profit.
As a trader, this is the the most ideal trade one can dream of!
How has been your trades lately?

BSE Sensex Important levels we are likely to see some corrections , I have marked some imp levels based on trend lines , Demand supply and FIb Levels .

BANKNIFTY Short Setup after 2700+ Long Trade on RisologicalBANKNIFTY Short Setup after 2700+ Long Trade on Risological
So, finally we see a reversal on Banknifty after a massive rally of 3000+ points out of which we were able to catch about 2750+ points.
The chart looks bearish on 15m time frame and I took a small short, just a bit concerned about any potential sideway move.
Have a look at the chart Ive shared to get the entry, stoploss and profit targets of this BankNifty short trade.
Best regards!
Namaste!

IDBI BANK - Short Trade, Profit Target 3 Done using RisologicalIDBI BANK - Short Trade
Guys,
Just look at this one sided move of IDBI Bank.
Trade Entry on 26 August at 98
CMP - 88!
Trailing stop loss at 93.
The price might reach 85-86
Thats the last target shown on the chart.
I love such stress-free trades TBH :)

BANKNIFTY 1200+ points Shorts Setup?? OMG!! The Risological swing trader has given a shorts setup indicating a whopping 1200+ points short opportunity.
Now, Ive taken a small trade here, at the entry.
It looks like some big moment is coming shortly.
Lets keep a close watch!!

#EURUSD: +300 pips buying opportunity one not miss! FX:EURUSD
We have an excellent opportunity to buy a swing entry on eurusd, our previous few setups has hit the target, now since the price is in correction zone, we think it is right time to identify the area where we think price can reverse from. This is the perfect and most ideal zone for buying, if price does not respect our zone then it will confirmed that trend has changed and we will no longer buy EURUSD. Good luck.
