HINDALCO INDS TRADE SETUP HEAD AND SHOULDER +Elliote Wave Hello Guys, Sorry due to busy schedule not uploading any setup from past 24 hour
Hindalco Inds Good for buying For short term profit
when you look at 15 Min chart you see a head and shoulder pattern for target 127 I mention below
According to elliote wave principle now we are riding on 5 the wave which is the last wave if it moves further upward we can see the level of 130-135 easily
Thanks
Indianmarket

MRF Sell Setup For swing Trader !The location of trading activity. At the end of the chart, on the Upper right, we can see that the trading activity moves in the lower part of the value area, between the control and the value Low. This is uncharacteristic for an Uptrend. Additionally, the price rotations are becoming narrower, it is starting to rotate between the control and value Low. In an Uptrend, when price rotations become small and they happen in the upper part of the value area, the trend is most likely to end.
You can short MRF below 56600 Level with SL: 57450, Target: 55k,54k
Thanks You can share your view on MRF with us
Thanks

Nifty 50 For 19/5/2020You Can short below Low of the previous candle,
With stop-loss at 8966 level Target 8666-8600
Thanks
LOL Looking like House Pattern, with floor or ceiling

Strong: Elliote(5+3) + Price Action breakout + Volume profile Hello guys before I write anything I say something that's its takes hours to analysis a single chart so please like it.
Elliote wave: 5+3
=>> 5 Impulsive wave done by Piramal Enterprise at 629 0.618 fib level according to wave principle, Currently It's riding on Corrective wave and its have 3 waves with correction of 1 fib which is at 1760 level = 4 wave
Price Action Breakout:
=>>According to its theory its touches there lower value with excess price with pinbar shows rejection to falling more down and move toward control price if it breaks the level of control price then we can see Piramal at upper value soon.
Volume Profile:
=>> As you know little bit about volume profile you can see Price at this volume high which means institutional investor taking entry at this price for reversal.
Buy Strongly ::::: like Like
Thanks need your support by liking it.

Short Setup of IPCA In day or weekly Time Frame !Lol I know Its confusion getting lots of lines but don't worry you can IPCA lab with stop loss 1650.
Looks weekly :
Shown rejection in weekly
Conclusion: in All tie frame It's looking for Short opportunity.
Thanks

Short setup for Bajaj Auto for day trader !According to wave principle Bajaj Auto looking Clear short with accurate fib level Short Bajaj auto: 2670-2700, Sl: 2770, Target 2600-2500-2400
Thanks, Message for further info !!

Cipla Shiftting closer to Target : 500=>time to sell.
I LIKE, then you will get a notification on Cipla .
I update on telegram

Tata Elxsi Buy After 780 !!Hello buddies,
buy only after 780 for target toward 810-835-860, Stoploss: 755
Thanks, tired from writing more about idea LOL
I mention everything in the chart

Kotak Mahindra bank Elliote + Price action breakdownHello Friends
Don't Take any trade its just view we get a better opportunity of confirmation trade in it After breaking it out !!
Waiting for new control price
According to Elliote wave its target toward 263
30 min
Lol I am confused in it
Thanks

Ashok leyland below Value area.See how value creates support and resistance zones for price. supply and demand and how the sellers position themselves at the value high and buyers at value low. Once these levels get broken, there is a change in supply and demand dynamics. As you can see in the chart it was broken with pinbar ( shown rejection).
Long Ashok Leyland Target toward 50-53
Thanks

Mahanagar Gas toward 880After the initiative selling away from the big uptrend, value price makes a small shifting value. At this point, you need to start looking for the new control of price. I want you to go through the following thinking process when looking at this chart. Value is moving up, the control price is pointing up so we are in an uptrend for the moment. The trading activity is taking place on both sides of the control, we cannot see a clear difference in the volume of activity on the two sides of the value area. This indicates that the uptrend is not very strong. It is probably just a short move upwards, correction of price in a bigger downtrend on a higher timeframe.
Short Mahanagar Gas Target toward 907-880,
Stop: 944
Thanks

CSB BANK RESISTANCE @121 SHOWING REJECTION MULTIPLE TIME Hello, guys very good morning,
Short csb bank: 119 for target toward 109 with stop: 122.50
Thanks like and share with your known !!

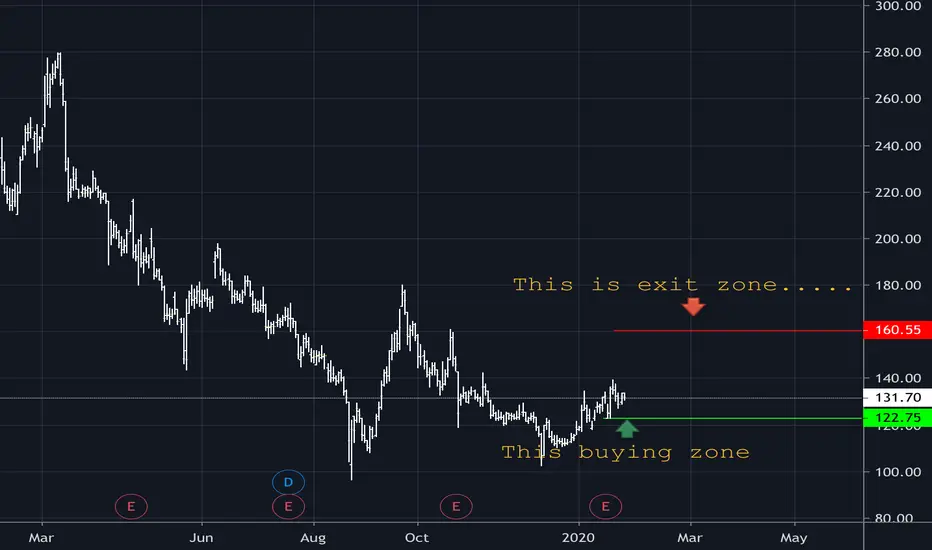
Exide industries analysis by wave theory !!Hello friends its weekly chart of Exide Industries
Those who are like to buy a cheap share for their portfolio can look toward Exide industries, Buy Exide life between 130-140 with stop loss 112
for toward 171-190-220
Thank you

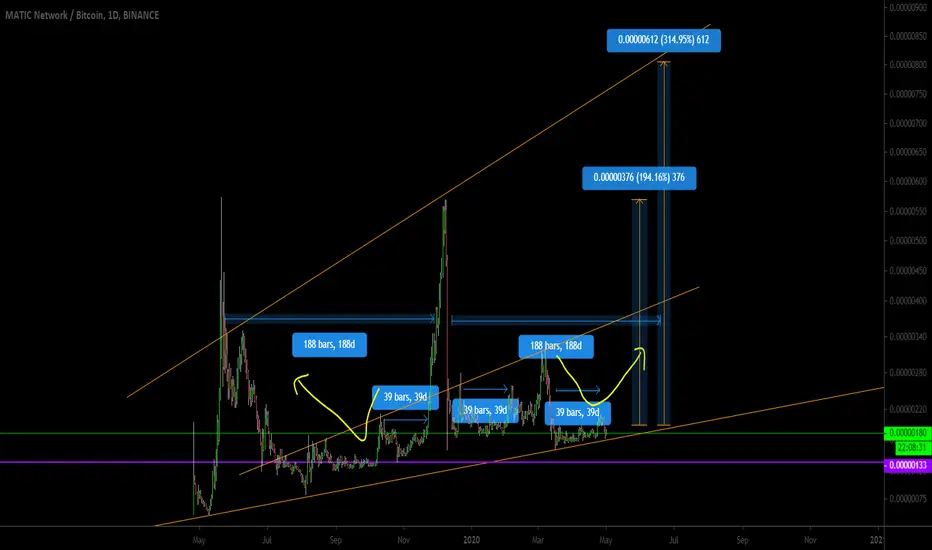
Beautiful chart on MATIC/BTC - Up to 300% ++ gains!This is one of the strongest project im eyeing on. Matic produced more than 10X back in Binance IEO during bear market.
Backed by COINBASE Ventures. this coin have potential to shoot past highs.
Rumour of it getting listed on Coinbase after Mainnet, and Coinbase is using Matic side chains(not sure where the source is, if anyone can point out would be great)
Phase 1 of Mainnet is completed successfully. Phase 2 to be completed in about 1-2 weeks.
Mainnet is only weeks away.
50+ DApps are building on Matic already.
Will Coinbase allow Matic Staking on their platform soon? (this will cause bulls after bulls..just like Tezos did in the past)
Many industry investors are also loving matic.
Chart wise, it looks like it is following reverse pattern from Oct 2019 backwards from my yellow arrows.
Now 175-195 sats is a really good buying zone as prices are accumulating..
Do note im not a financial advisor. this is only my opinion.
Thanks for reading and good luck all!
BAJAJ FINSERV IDEA Hello guys,
Welcome back to my new idea
SHARE LIKE COMMENT
THANKS, REGARDS
RAVINDRA

MANAPPURAM FINANCE : EXTREMLY BULLISH SETUP Hey guys very good morning,
How are you doing nowadays?
If you are taking trade which is less risky and high return then you look toward manappuram finance Long at a current level (positional trade as well)
Stoploss 100
Target 118-125-135-140

TCS : Wave analysis and price action First an all good morning friends,
Those who are doing trading And likely to trade TCS then they can Short it, For toward target 1745 - 1600
Genuine if you like my ideas then please like it, I need your support.
Thanks

is nifty 50 losing strength ?nifty is showing ascending triangle on 30 mini chart with gap up opening from last 3 session.
but now its 3 rd gap showing intensity to open with gap is reduced,
it might be possible next session will open with small gap and then will give downside breakout.
i hope its is meaning full
please like and follow.


Dmart Long , looks beautiful and bullish and strong uptrend Dmart seems in demand and price action is respecting well to SR levels
seems pretty bullish