IDBI Bank Ltd Bat pattern Trade Set UpThe idea here is about IDBI Bank Ltd:
IDBI Bank Ltd. engages in the provision of commercial banking services to retail and corporate customers. It operates through the following segments: Corporate and Wholesale Banking; Retail Banking; Treasury; and Other Banking and Group Operations. The Corporate and Wholesale Banking segment includes corporate relationship covering deposit and credit activities other than retail, as well as corporate advisory and syndication, project appraisal, and investment portfolio.
My view is bullish (Swing trade) for the below observed News & technical factors.
News: There is a potential merger up news in air at the moment of publishing this idea. Do your own research to find out more information.
Points as per TA on a Daily & Weekly chart:
1.Downtrend channel breakout & retested & trading above 200 EMA & 20 EMA support established on daily chart as per below:
2. Trading below 200 EMA & 20 EMA support established on a weekly chart as per below:
3. Anti Cypher pattern completed on weekly chart, Target 1 achieved from entry point & due to lack of momentum or global uncertainty price has been pushed below Target 1. Price has taken support on 20 EMA as per below:
4. Bat Pattern completed on daily chart, Entry point confirmed price towards target 1 as per below:
5. MACD Converging towards signal line on daily as well as monthly chart which is a signal for upward momentum as per below(daily MACD):
MACD above signal line on weekly chart.
6. Ichimoku Cloud analysis: Kumo Breakout & Kumo Twist on a daily chart is strong upward momentum at the time of publishing. However on weekly it’s neutral.
7. RSI is at 53.68 on a weekly Chart and 52.63 on daily chart at the time of publishing.
8. Hull Moving average and other moving averages on weekly & monthly chart is a strong buy & on Daily Hull Moving average is sell.
9. ADX (Average directional index ) trend strength is at 20.54 on weekly & 16.58 on daily, which indicates a absent or weak trend (ADX between 0-25 is a Absent or weak trend) and 31.81 on monthly chart which indicates a strong trend .The trend seems to be picking up.
10. It is also suggested to keep a look on Bank Nifty, as its taken support on 20 EMA on Weekly and below on daily as per below :
11 Ichimoku cloud is strong upward moment for Bank Nifty on weekly and daily chart as per below :
Projected Target with %: provided in the chart as per Bat Harmonic pattern, coincidentally Target 4 of Bat is almost aligned with Target 3 of Anti Cypher.
Stop Loss: Provided in the chart for Bat .
Disclaimer: “The above is an Educational idea only and not any kind of financial or investment advice. So please do your own DD (Due Diligence) before any kind of investment”.
Do you like my TA & ideas!!
Want to keep yourself updated with current market action? Then don’t forget boost & to subscribe for more analysis.
Do leave your valuable feedback & comments for any improvisations.
Cheers.
Indianmarkets

VIP Industries Clean BreakoutThe idea here is about VIP Industries:
V.I.P. Industries Ltd. engages in manufacturing and marketing of luggage, bags, and accessories. The firm's product includes hard and soft luggage-trolleys; suitcases, duffle bags, overnight travel solutions, executive cases, backpacks, and travel accessories. Its brands include VIP, Carlton, Caprese, Footloose, Alfa, Aristocrat, and Skybags.
My view is bullish (Swing trade) for the below observed technical factors.
Points as per TA on a Daily & Weekly chart:
1.Contracting or Symmetrical triangle breakout & retested on weekly chart as per below:
2. Bearish Crab Harmonic CD leg under formation at the time of publishing as per below:
3. EMA 20 support established on weekly chart as per below:
4. Trading above 20 & 100 EMA on daily chart.
5. Double Bottom formation competed & Neck line breakout completed as per below:
6. Ichimoku Cloud analysis: Kumo Breakout & Kumo Twist on a daily,weekly & monthly chart is strong upward momentum at the time of publishing. This is a very good signal for upward momentum.
7. RSI is at 62.82 on a weekly Chart and 66.72 on daily chart at the time of publishing.
8. MACD above signal line on daily & weekly chart which is a signal for upward momentum.
9. Hull Moving average and other moving averages on a daily,weekly & monthly chart is a strong buy.
10. ADX (Average directional index ) trend strength is at 10.45 on a weekly which indicates a absent or weak trend (ADX between 0-25 is a Absent or weak trend) and 32.57 on a daily chart which indicates a strong trend .The trend seems to be picking up.
Projected Target: provided in the chart as per Cypher harmonic pattern.
Stop Loss: Provided in the chart.
Disclaimer: “The above is an Educational idea only and not any kind of financial or investment advice. So please do your own DD (Due Diligence) before any kind of investment”.
Do you like my TA & ideas!!
Want to keep yourself updated with current market action? Then don’t forget boost & to subscribe for more analysis.
Do leave your valuable feedback & comments for any improvisations.
Cheers.

United Spirits (McDowell_n) Waiting for Breakout.The idea here is about United Spirits (McDowell_n).
Mentioned below are the points to be considered
Points as per TA on a Weekly Chart:
1. Engulfing candlestick formation on a weekly chart at the time of publishing.
2. Anti Cypher Pattern looks ahead.
3. Downtrend Channel resistance tested might break the channel in coming week.
4. Resistance on 20 EMA on a weekly chart, support established on 50 EMA & Trading above 200 EMA on weekly chart.
4. Kumo Twist & Breakout on a weekly chart is neutral & currently consolidating. However, Kumo Breakout & kumo Twist on daily chart is strong for a upward momentum.
5. RSI is at 49.34 on a weekly Chart at the time of publishing.
6. MACD Crossover signal line on weekly chart.
7. Hull Moving Average is a Buy Signal on Daily, Weekly & monthly chart.
8. Enter long if Price breaks above the resistance. In, any case keep a price alert.
9. Volume Spike in weekly chart signals strong Momentum.
Projected targets as per Anti Cypher Pattern & Downtrend channel provided in the chart.
Stop Loss: Enter only if price breaks the trend & Retests.
Disclaimer: “The above is an Educational idea only and not any kind of financial or investment advice. So please do your own DD (Due Diligence) before any kind of investment”.
Do you like my TA & ideas!!
Want to keep yourself updated with current market action? Then don’t forget boost & to subscribe for more analysis. Do leave your valuable feedback & comments for any improvisations.
Cheers.

Madras Fertilizers Traiangle breakout The idea here is about Madras Fertilizers:
Madras Fertilizers Ltd. engages in the manufacture and marketing of ammonia, urea, and complex fertilizers. It also produces bio-fertilizers and markets organic fertilizers and neem pesticides.
I am short term bullish on Madras Fertilizers due to below observed technical factors.
1. Contracting or Symmetrical triangle formation on a weekly chart as per below:
2. Possible bearish Butterfly pattern under formation as per below:
3. Trading above 200 EMA & Support established on 20 EMA on a weekly chart as per below:
4. Ichimoku Cloud analysis: Senkou Span B support established on a daily chart as per below:
5. Ichimoku Cloud analysis: Kumo Break out and kumo twist strong buy for upward momentum on daily & Weekly chart.
6. RSI is at 49.47 on a Daily Chart & 55.97 on a weekly chart at the time of publishing.
7. MACD below signal line on weekly chart & way converging towards signal line on daily chart.
8. Hull Moving average on daily & monthly chart is buy & sell on Weekly chart & other moving average is a strong buy on Weekly & monthly chart.
9. ADX (Average directional index) trend strength is at 24.93 on a weekly and 25.83 on a daily chart which indicates a strong trend ( ADX between 25 - 50 is a strong trend) in the current direction.
Projected targets as per bearish butterfly patterns provided in the chart.
Stop Loss: provided in chart as per contracting or symmetrical triangle.
Disclaimer: “The above is an Educational idea only and not any kind of financial or investment advice. So please do your own DD (Due Diligence) before any kind of investment”.
Do you like my TA & ideas!!
Want to keep yourself updated with current market action? Then don’t forget boost & to subscribe for more analysis.
Do leave your valuable feedback & comments for any improvisations.
Note : use the Load new Bars forward button to know the current movement.
Cheers.

Send it to ZEROTime for the markets to heal. Threw retail traders off the hook, paired their orders in full, now to sit back and watch.

UBL(United Breweries Ltd) Waiting for BreakoutThe idea here is about UBL (United Breweries):
United Breweries Ltd a flagship company of UB Group is engaged in the manufacturing and marketing of beverages.
1. Broken out of Ascending Triangle , Double bottom & retesting of support & neck level completed on a weekly chart as per below:
2. Waiting for breakout of Ascending Triangle & Double bottom on a daily chart at the time of publishing.
3. Trading above 20 & 200 EMA on daily chart & weekly chart.
4. Ichimoku Cloud analysis: Kumo Breakout & Kumo Twist on a daily, weekly & monthly chart is Strong buy for an upward momentum.
5. RSI is at 59.85 on a Daily Chart & 58.87 on a weekly chart at the time of publishing.
6. MACD Way above signal line on daily & weekly chart .
7. Hull Moving & other moving average is a strong Buy on Daily, Weekly & monthly chart. This is a very strong signal for upward momentum.
8. Wait for breakout & retest completion for long entry. However, keep in watch list for the week & alert for price momentum.
Projected targets as per Ascending triangle & Double bottom provided in the chart.
Stop Loss: provided in chart.
Disclaimer: “The above is an Educational idea only and not any kind of financial or investment advice. So please do your own DD (Due Diligence) before any kind of investment”.
Do you like my TA & ideas!!
Want to keep yourself updated with current market action? Then don’t forget boost & to subscribe for more analysis. Do leave your valuable feedback & comments for any improvisations.
Cheers.

Positional view on #VEDL #VEDANTA My positional view on NSE:VEDL
Target would be Rs. 295. My stop loss is Rs. 260 only.
Note: This is my personal analysis, only for learners

IPCA LABORATORIES : Potential Harmonic Reversal The idea here is about Ipca Laboratories:
Ipca Laboratories Ltd is a fully-integrated Indian pharmaceutical company manufacturing over 350 formulations and 80 APIs for various therapeutic segments.
1. Bullish Cypher pattern completed on a daily chart potential trend reversal expected. However, if the trend continues downward then the pattern is nullified. Out of Falling wedge trend at the moment.
2. What is Cypher Pattern? Explained in the below image:
3. Double top completed and currently looks like a Double bottom pattern under formation as per chart at the time of publishing.
4. Trading way below 20 & 200 EMA on Daily chart & between 20 & 200 EMA on a weekly chart.
5. Ichimoku Cloud analysis: Kumo Breakout & Kumo Twist on a daily, Weekly chart is Strong bearish & Strong Bullish on monthly chart.
6. RSI is at 30.37 on a Daily Chart at the time of publishing. This indicates almost oversold at the time of publishing.
7. MACD below signal line on daily chart, and converging towards signal line.
8. Hull Moving average on a daily & monthly is sell & on a weekly chart is a buy.
9. Wait for trend reversal & retest may be for long entry (short term). However, keep in watch list for the week & alert for price momentum.
Projected targets as per Cypher Pattern provided in the chart.
Stop Loss: Provided in chart as per Cypher pattern.
Disclaimer: “The above is an Educational idea only and not any kind of financial or investment advice. So please do your own DD (Due Diligence) before any kind of investment”.
Do you like my TA & ideas!!
Want to keep yourself updated with current market action? Then don’t forget boost & to subscribe for more analysis. Do leave your valuable feedback & comments for any improvisations.
Cheers.

GRP LTD Double Bottom BreakoutThe idea here is about GRP LTD:
GRP Ltd is engaged in the production of reclaim rubber from scrap of whole tyres, tread peelings, natural rubber tubes, butyl tubes, molded rubber products for different applications in both, tyre and non tyre rubber products..
1. Broken out of Ascending Triangle, Double bottom & retesting of support & neck level in progress at the time of publishing.
2. Trading above 20 & 200 EMA on daily chart.
3. Ichimoku Cloud analysis: Kumo Breakout & Kumo Twist on a daily chart is Strong for an upward momentum.
4. RSI is at 70.46 on a Daily Chart at the time of publishing.
5. MACD Way above signal line on daily chart.
6. Hull Moving & other moving average is a strong Buy on Daily, Weekly & monthly chart.
7. Wait for retest completion for long entry. However, keep in watch list for the week & alert for price momentum.
Projected targets as per Ascending triangle & Double bottom provided in the chart.
Stop Loss: provided in chart.
Disclaimer: “The above is an Educational idea only and not any kind of financial or investment advice. So please do your own DD (Due Diligence) before any kind of investment”.
Do you like my TA & ideas!!
Want to keep yourself updated with current market action? Then don’t forget boost & to subscribe for more analysis. Do leave your valuable feedback & comments for any improvisations.
Cheers.

TATA ELXSI good for swing trade TATA ELXSI GOOD FOR SWING TRADE
This stock is support the moving average 44 and support line so it is a good stock to buy
BUY =9085
sp =8800
1st target =9547
2nd target = 9800

(Tutorial) World Markets & their affect on Indian Stock Market!Hello Traders/Investors,
Lets learn World Stock Markets and How it affect us in India on Daily/Weekly and even on long-term basis.
Note: this topic is specifically for Traders (specially Day traders) and also Investors might find it interesting read.
- US is called mother market and we're (i.e. Indian stock market) child market.
- US market gives a queue on how world and our market would perform based on it.
- Sectors like Banks (Dow Jones Bank index) n Tech/IT (NASDAQ) work pretty hand in hand with rest of world in terms of giving us a idea of direction towards which sector can have chances of moving by how much %age today.
- - SGX Nifty , its a Nifty's Future contract which is traded in Singapore Exchange and gives a good idea on start of our markets. SGX Nifty timings : 6.30 AM to 11.30 PM
- Asian markets specially South Korea, Hang Seng n Japan market we should watch carefully in morning to track the direction of markets. We belong to pretty much similar basket.
- European Markets, CAC, DAX and FTSE we should get a median of these 3 exchanges to know how much %age they're moving. Just an observation here, our Indian markets usually stay closer to DAX movement.
- Emerging markets (short form : EMs) : Emerging markets generally do not have as highly developed market and regulatory institutions as those found in developed nations. Market efficiency and strict standards in accounting and securities regulation are generally not on par with advanced economies (such as those of the United States, Europe, and Japan).
- Some of the most rapidly emerging countries include Brazil, Turkey, Russia, India, and China. Also some oil rich nations are also part of this list.
- To get a holistic picture of world markets.. get a queue from yesterday's closing of world markets specially US alongwith US futures which are very important.
- Then, in mornings look at Asian Markets n SGX Nifty to understand where our markets might open. Around afternoon when European markets open you get an idea where our Indian market might stabilise n close. Also, we can look at European futures to get idea on where Euro markets might open.
- Lastly macro economic data like Commodity prices specially Crude oil , USD INR n Dollar Index give a clarity on the markets. Higher Dollar n lower Rupee would cause panic in stock markets usually. Similarly, higher crude oil prices indirectly reduces countries foreign reserves n also affect business due to rising transport costs causing more expenses n less income.
- Cryptos movements can also affect markets now days, a big downmove on cryptos n hit many stop losses n cause for margin calls n hence companies might have to liquidate other assets of individuals like stocks etc. go get back their money.
- Honest mentions: Sometimes some macros are in news, then in those days stock markets start mimicking their charts.. it can b currency pair USDINR , US 10yrd BOND yield, Crude OIL sudden surge or drop in prices and most recently, NIFTY is pretty closely mimicking the US30 futures chart trend on day trades.
- My personal hack: I do all my Technical Analysis on these charts n not just on NIFTY and BANKNIFTY etc. I draw all the Supply n Demand zones, Channels, Trendlines etc. to get queues from them to implement it on my trading in Intraday in India. Usually it works like a charm!
World major stock markets timings in IST (i.e. Indian Standard Timings) :
North America Stock Exchange Timings:
Country Stock Exchange Opening Time (Indian Timing) Closing Time (Indian Timing)
US NASDAQ 7 : 00 PM 1 : 30 AM
US NYSE 7 : 00 PM 1 : 30 AM
Canada TMX Group 8:00 PM 2:30 AM
European Stock Exchange Timings:
Country Stock Exchange Opening Time (Indian Timing) Closing Time (Indian Timing)
UK London Stock Exchange 1 : 30 PM 10 : 00 PM
European Union Euronext 12:30 PM 9:00 PM
Germany Deutsche Borse 12:30 PM 2:30 AM
Switzerland SIX Swiss Exchange 1:30 PM 10:00 PM
Spain BME Spanish Exchange 1:30 PM 10:00 PM
Asia-Pacific Stock Exchange Timings
Country Stock Exchange Opening Time (Indian Timing) Closing Time (Indian Timing)
Australia Australian Security Exchange 5:30 AM 11:30 AM
Japan Japan Exchange Group 5:30 AM 11:30 AM
Hong Kong Hong Kong Stock Exchange 6:45 AM 1:30 PM
China Shanghai Stock Exchange 7:00 AM 12:30 PM
China Shenzhen Stock Exchange 7:00 AM 12:30 PM
Taiwan Taiwan Stock Exchange 6:30 AM 11:00 AM
South Korea KRX Korean Exchange 5:30 AM 11:30 AM
India NSE and BSE 9:15 AM 3:30 PM
You can google n find most of Live market details on many websites, I usually enjoy Investing .com for their simple UI and charts.
Please take all positions at your own risks and these are my personal views on analyzing markets. I'm not responsible for any losses incurred by you!
Regards,
Anshul

Nifty 50 in Connection with DOW THEORYAs you can see from 18600 Nifty is making new Higher Lows and Lower lows.
As per Dow theory assuming the breakout projects the uptrend and trend reversal considering 16400 as the low.
A New Low should be formed above 16400 to validate this analysis. If 16400 is not respected dow theory is voilated,
and its going to be a bloodbath, Lets hope nifty makes a new low around 17150-250
I will update on the Idea regularly.


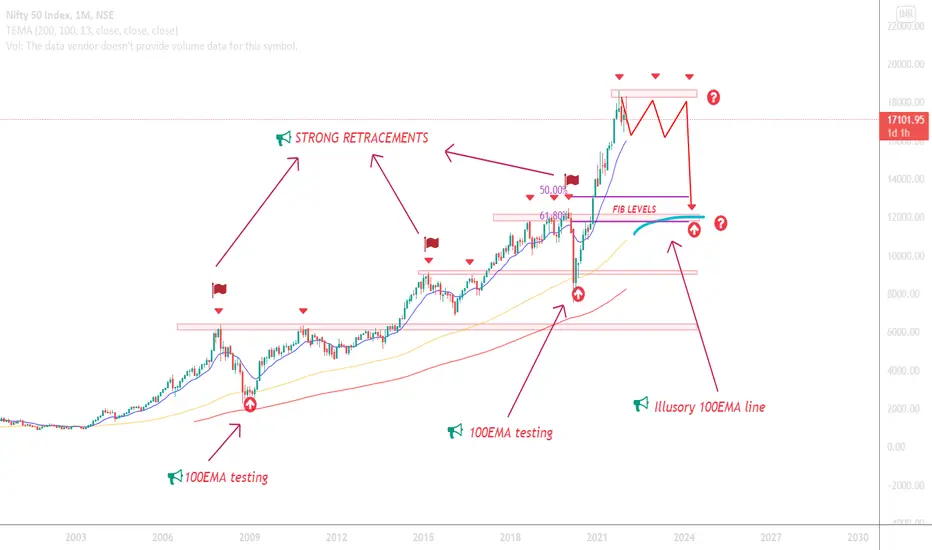
CHANCES FOR NIFTY TO FALL ?Only an illustration of market considering a long term in monthly chart.
The big question is will history tend to repeat itself?. The analysis shown here is just a view on the market considering the theory behind the market and also taking into account about the 100ema as well as possible retracements.
This is why the market needs to be approached by a completely neutral position.
React accordingly, catch the big bull if markets collapse to similar levels


JustDail Trade SetupEntry Around 900.00
Target StopLoss = 856.00
Target one = 977.80
Target Two = 1095.50

NIFTY BEARS ON ACTION SOON IT SEEMS...Fundamentally its bears all over. At this time it seems market are a bit overpriced due to the confusions and panics that fly around due to the covid stats and news.
when it comes to T.A market is at a strong range of resistance.Already we have a clear indication that bears are here for the party.
Go short or just do nothing.
*based on1D charts , for swing trades only


BUY SHRIRAM TRANSPORT FINANCE IN PROPER DEMAND ZONEBUY SHRIRAM TRASNSPORT FINANCE
Buy=1330
SL=1270
Target=1470
In daily and weekly demand zone
Must buy

Coal India Hi
Coal India look attractive on current level & it should be in your portfolio on every dip for 2 months time....it will give good return.
Best of Luck....!!!

NMDC LONG Hi
NMDC looks good & attractive on current levels for 228.....this is portfolio stock & this require min 2 months time.
Best of Luck....!!!
