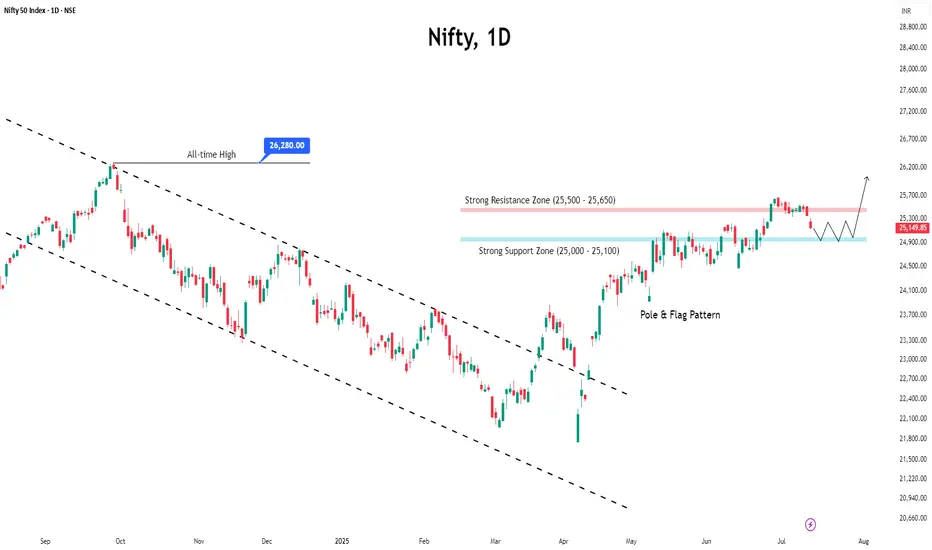
Nifty Dips, Suggests Range-Bound Movement AheadIndian markets ended the week with a decline of nearly one percent, driven by lingering concerns over global tariffs and a weak start to the earnings season.
The 25,500 level has now turned into a strong resistance zone, marked by heavy call writing, while 25,000 continues to act as a solid support level backed by significant put writing.
Given these dynamics, the index is likely to enter a consolidation phase, with upcoming earnings announcements expected to keep sectoral volatility elevated.
Indianstockmarket
VI Stock(India) Looking for bullish Rally! {5/07/2025}Educational Analysis says that VI Stock (India) may give trend Trading opportunities from this range, according to my technical analysis.
Broker - NA
So, my analysis is based on a top-down approach from weekly to trend range to internal trend range.
So my analysis comprises of two structures: 1) Break of structure on weekly range and 2) Trading Range to fill the remaining fair value gap
Let's see what this Stock brings to the table for us in the future.
Please check the comment section to see how this turned out.
DISCLAIMER:-
This is not an entry signal. THIS IS FOR EDUCATIONAL PURPOSES ONLY.
I HAVE NO CONCERNS WITH YOUR PROFIT OR LOSS,
Happy Trading, Fx Dollars.

$NSE:NIFTY is Going to Burst Up Side ! SkyRocketing TIme is NearNSE:NIFTY is Going to Burst Up Side ! SkyRocketing TIme is Near
NIFTY 50 BULLISH REVIEW (My View) 💥
📈 Current Bias: BULLISH
✅ Nifty 50 showing strong resilience above key support levels.
✅ The index is holding well above recent consolidation zones and looks ready for further upside.
✅ Momentum indicators (like RSI) are staying in positive territory, showing sustained strength.
✅ Higher highs & higher lows structure intact on daily chart — bulls in control!
🔑 Key Levels:
👉 Immediate support: 23,333 - (watch for buying interest here)
👉 Resistance ahead: 23,850 - 23,900 (break above = fresh rally potential)
🌟 What I’m Watching:
🚀 Breakout above 23,900 could open doors towards 24,200+ levels in the coming sessions.
🚀 Strong sector participation from banks, IT, and autos — a broad-based rally is a positive sign.
🚀 Keep an eye on global cues + FII activity — may add fuel to the trend.
NSE:NIFTY is Going to Burst Up Side ! SkyRocketing TIme is Near

NIFTY is Testing its long term Trend Line.I’ve been keeping an eye on the ‘Watch Out’ area and the trend line that’s being tested. I’ve been following this trend line for a while now, and I’m excited to share some potential scenarios that could unfold in July.
Here are a few things to keep in mind:
1. The 25450 - 25550 range could become a key resistance and support area.
2. If NIFTY successfully retests this trend line and shows some upward movement, the next target could be 26000. In this case, I would recommend buying July 26000 Call options.
3. If NIFTY can’t hold this retest (which is less likely given NSE:NIFTY the current bullish market sentiment), our next watchout zone could be 25000 - 24800.
4. We might even be seeing an all-time high NIFTY soon!
Disclaimer: Please do your own research before investing. This is just my personal opinion, and I don’t force anyone to invest based on my ideas.

NRB Bearing Limited - 290 CMP Short-term Looking good for 100%+Good Buy For Short- Term 1 Year Investment Horizon.
NRB Bearing Limited - 290 CMP
Expected Return - 580 (100)%
Drawdown - 205 (35%)
*This POST for educational purpose only. Concern your advisor before investing in market related instrument...*
- AB_INV_7

KBCGLOBAL Looks bullish!A potential entry is identified at 0.46. The first target is 0.62, representing a +34.78% gain from the entry point. If the upward momentum continues, the long-term target is set at 0.87, offering a total potential gain of +89.13% from the initial entry. This trade presents a strong risk-to-reward profile for both short-term traders and long-term investors. Proper risk management is essential, especially if price action weakens below the entry level.

Trade setup HINDZINCHINDZINC Is approaching a key support level at 440. This level is critical for determining the stock's next move. A breakdown below 440 could signal increased bearish momentum, potentially leading to further downside. On the other hand, if the 440 level holds strong and shows signs of support, it could mark the beginning of a bullish reversal. In that case, there's a significant upside potential, with a possible long-term target around 655. For now, it's important to stay patient and wait for a clear signal—either a breakdown or a bounce from the current level—before making any trading decisions.

IDIA Range Accumulation – Bullish Only With Fundamental TriggerThe stock is currently trading inside a tight range, indicating a phase of consolidation.
📉 Buy Zone: ₹6.38
I’m planning to accumulate if price drops near this zone. From a technical view, it’s a strong demand area. However, for the bullish breakout to sustain, we’ll need strong fundamental support — like earnings, news, or sector momentum.
🔍 If fundamentals align, this could become a long-term multibagger setup.
✅ Strategy:
Wait for ₹6.38 zone
Accumulate small quantities
Hold for long-term with regular news tracking
💬 What do you think?
Would you wait for breakout or buy inside the range?
#TechnicalAnalysis #SwingTrade #LongTermView #SupportZone #BreakoutSetup #StockMarketIndia

Cochin Shipyard – Key Level Retracement & Long SetupCochin Shipyard is perfectly retracing to a key support zone, showing strength for a possible bounce.
🔹 Entry: ₹2149
🎯 Target 1: ₹2543
📈 Potential Gain: ~18.3%
🕒 Plan: Holding position unless structure shifts
This setup aligns with the current trend — looking for a continuation after healthy retracement. Tight stop-loss recommended for capital protection.
💬 What's your view on this trade?

HDFC Accumulation Breakdown Setup?HDFC seems to be building an accumulation range with:
Range High: ₹1955
Range Low: ₹1908
Currently, price is consolidating within this zone. I'm biased to the sell side for now, expecting a potential breakdown below the ₹1908 level.
⚠️ No confirmation yet — it's a “wait and watch” scenario. A strong close below the range low could trigger momentum selling.
💬 What's your view on this setup?

Buy the Dip: Tata Motors Set to Zoom from ₹713 to ₹799!Consider buying Tata Motors stock below ₹713 with a long-term target of ₹799, offering a potential profit of approximately 12%.

Equity Research Flash – BEML Ltd.CMP: ₹3,242.10 | Breakout From Falling Trendline
BEML has decisively broken out of a falling trendline and is now sustaining above a key consolidation zone. With strong bullish candles, a rising RSI, and healthy volume spike, the stock signals bullish momentum. Immediate resistance lies at ₹3,420–₹3,480. Sustained move above could target ₹3,750+. 20/50 EMA crossover supports the upward trend. Traders may consider entries on dips with SL near ₹3,080.
For educational purposes only

Equity Research Flash – Hexaware Technologies Ltd.CMP: ₹722.35 | Bullish Momentum Post Trend Reversal
HEXT shows a bullish breakout from a falling trendline, with RSI near 60 and strong volume uptick. The price reclaimed the 0.5 Fibonacci level, eyeing next targets at ₹749.85 (0.618) and ₹793.35 (0.786). Fundamentally strong with robust revenue growth, improving ROCE (26.4%), and low debt. A move above ₹750 could trigger further upside. Accumulate on dips with SL at ₹688.
Recommendation: Positive | Buy on Dips Near ₹700
For Education Purpose only

India 50 Major Market Caution Signs Emerging!Any time you see multiple head-and-shoulders patterns forming on the chart often signals serious trouble ahead.
Stay vigilant for a break in the right shoulder of this massive head-and-shoulders pattern currently developing.
As a macro trader, I focus on the big picture—economics and long-term trends. While markets like India and long-term trading don’t get much TV coverage, my aim is to shift your perspective and enhance your trading strategy.
Follow this post to track how multiple head and shoulders patterns and a rising bearish wedge evolve over time.
Let’s ignite your curiosity and elevate your overall trading and investing.
Like, follow, and subscribe to join me in tackling these wild markets. Let's get to 5,000 followers!

Massive Move Incoming? CCL PRODUCTS LTD Price Prediction!Trade Recommendation
Buy Strategy
Entry Point: ₹850-860 (after confirmation of breakout above the Strong High)
Target Price: ₹928 (next resistance level)
Stop Loss: ₹800 (below nearest support zone)
Sell Strategy
Entry Point: Below ₹850 (if rejection happens near the Strong High)
Target Price: ₹700 (next support zone)
Stop Loss: ₹900 (above resistance level)
Technical Observations
Resistance Zones: ₹900
Support Zones: ₹700
RSI: Check for overbought or oversold levels to confirm entry
SYMPHONY LTD CMP -1280 for 700%%Buy Long term 3-5 Years
Symphony Ltd
Cmp - 1277
Target 11000..
** This Post is for educational purpose Only, Please concern your financial advisor before investing in market related investment**

OIL – Oil India Ltd | Target: ₹429.00🟢 Trade Details:
LTP: ₹417.30
Recommended Buy Range: ₹415.50 – ₹416.00
🎯 Target: ₹429.00
🛑 Stop Loss: ₹408.70
🔍 Technical Snapshot:
✅ Strong bullish candle with volume confirmation
✅ EMA crossover supports the uptrend (9 EMA > 13 EMA)
✅ RSI at 62.22 shows healthy momentum
✅ Breakout above previous range box visible on Daily & 1H TF
📊 BB %B at 0.82 – still room before overbought levels
💼 Strategy:
Suitable for short-term MTF holding (2–5 days)
Risk-Reward ~1:1.5
Trail SL to cost once ₹424+ is breached
Use smaller timeframes (15m / 1H) to confirm entry with volume
For Education Purposes Only

NIFTY Resumes Its Bullish TrendHello traders! Today we will talk about an Indian stock market exchange NIFTY 50, as we see nice and clean pattern from technical and Elliott wave perspective.
As you can see, NIFTY is in an impulsive bullish rise on the weekly basis, which looks like a higher degree wave 3 of an ongoing five-wave bullish impulse by Elliott wave theory.
After recent corrective slowdown in subwave (4), which perfectly tested channel support line and 38,2% Fibonacci retracement, we can now see it extending even higher, ideally for subwave (5) of a higher degree wave 3 that can push the price even up to 28k-30k area this year, just watch out on short-term pullbacks.

"Nifty 50 Eyes Breakout from Key Support Zone"**Support Zone (Red Rectangle)**:
* Strong support between ₹24,290 – ₹24,340.
* Multiple price bounces have occurred here, indicating demand presence.
**Resistance Levels**:
* **Immediate resistance**: ₹24,409.65 (horizontal red line)
* **Next resistance**: ₹24,494.45
**Support Levels**:
* **Immediate support**: ₹24,290
* **Next support**: ₹24,240.65
**RSI (Relative Strength Index) – 14 Period**
* RSI is at **36.25**, near the oversold region.
* Indicates the index may be poised for a short-term bounce.
* Positive RSI divergence is not yet confirmed but should be monitored.
---
**Bullish Scenario**:
* A breakout above the black descending trendline (\~₹24,360) with volume can lead to:
* First target: ₹24,409.65
* Second target: ₹24,494.45
* Supported by wedge breakout and RSI recovery.
**Bearish Scenario**:
* Breakdown below ₹24,290 zone can trigger a fall to:
* First target: ₹24,240.65
* Second target: Lower bound of ascending channel (\~₹24,060)

RIDING THE INDIAN METAL RALLYThe Indian Metal Index (CNXMETALS) is shaping up for an exciting move! 🚀
LINK TO MY FULL REPORT -
drive.google.com
Through technical analysis, I’ve identified a strong inverse correlation between CNXMETALS and the Dollar Index (DXY) 📊.
Historically, when DXY weakens, Indian metal stocks tend to shine.
🔥 Key Observations:
✅ CNXMETALS Technical Setup – Strong indicators suggesting bullish momentum! 🏗️💰
✅ Stock Picks & Targets – I’ve highlighted key stocks that could benefit from this macro and technical setup! 📌💡
✅ Dollar Index at Crucial Support – A breakdown could fuel an upward surge in Indian metal stocks! 📉➡️📈
✅ Global Macro Trends – A quick dive into the global metal sector & its impact on Indian markets 🌍🔎
Metals are heating up, and the charts are telling a compelling story!
Are you tracking this trend?
Let’s discuss in the comments! ⬇️💬

INDIA HAS BOTTOMED MOVE LONG The chart is that of INDIA We now have two legs Down and to a nice .382 pullback .This now see a nice rally under Both wave counts . best of trades WAVETIMER

NIFTY still bearish targeting the 1W MA100 at 22250.The Nifty 50 Index (NIFTY) has been trading within a Channel Down pattern, with its latest Lower High being exactly on the 1D MA50 (blue trend-line). This caused the rejection that initiated the current Bearish Leg.
As we've already completed a 1D Death Cross, the last two times we saw a similar Channel Down was during December 2022 - March 2023 and October 2021 - June 2022. Both of those patterns hit the 1W MA100 (red trend-line) before forming a bottom and rebound.
The March 2023 in fact, was priced exactly on the 0.5 Fibonacci retracement level. With their 1D RSI sequences also identical, we expect the bearish trend to continue for around another 30 days before the Channel Down bottoms on the 1W MA100 - 0.5 Fib cluster. Our Target is 22250.
-------------------------------------------------------------------------------
** Please LIKE 👍, FOLLOW ✅, SHARE 🙌 and COMMENT ✍ if you enjoy this idea! Also share your ideas and charts in the comments section below! This is best way to keep it relevant, support us, keep the content here free and allow the idea to reach as many people as possible. **
-------------------------------------------------------------------------------
💸💸💸💸💸💸
👇 👇 👇 👇 👇 👇

HBL Engineering- Possible DOUBLE BottomPossible Double Bottom formed by HBL Engineering, major support held 515-520 on the weekly chart. Breakout above its 726 resistance with a clear close above should target 1000 gradually( the break out target)
