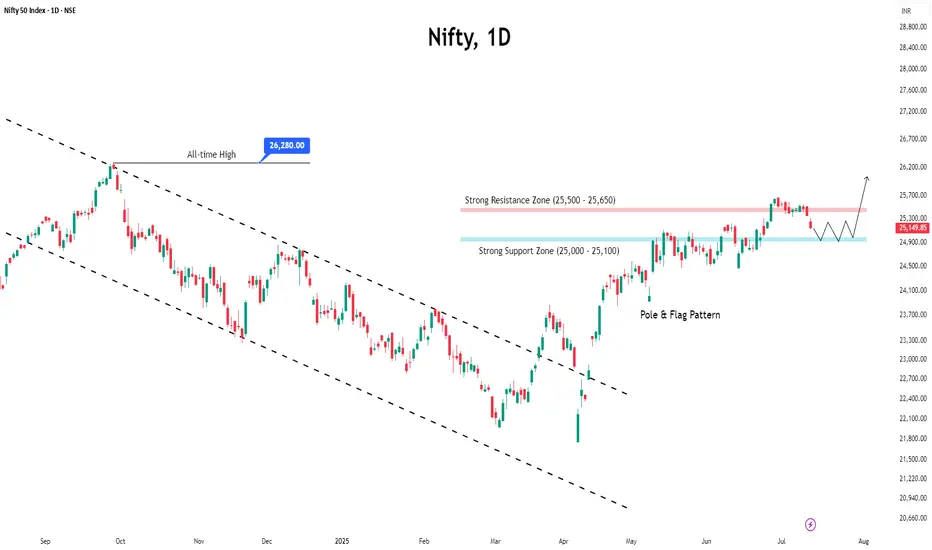
Pressure Builds on Nifty Before ExpiryThe Nifty traded in a tight range for most of the week but eventually slipped below the 25,000 mark, ending on a weak note.
With the monthly expiry approaching, the index is likely to remain under pressure, and volatility may pick up in the coming sessions.
Key resistance levels are seen at 25,200 and 25,500. A decisive move above 25,500 could trigger an upside breakout. On the downside, support is expected around 24,500 and 24,400.
Given the current structure, traders are advised to stay cautious, focus on selective opportunities, and avoid aggressive positions until a clearer trend emerges.
Indianstocks
HCL Copper 1M, TF Anticipating Growth & Key Levels ⚙️ Materials: Commodity Cycle Turnaround
(Green energy metals, China recovery)
Government of India Enterprise
Hindustan Copper Limited (HCL)
The company is undergoing a significant mine expansion, projecting a 5x increase in output. This positive development is already reflected in institutional interest, with DIIs increasing their exposure by 8.2% in Q1.
At the time of this analysis, the price stood at 273.
We've observed a volume climax at the bottom, suggesting a potential exhaustion of selling pressure and a base formation.
The white ghost candles pattern illustrate an anticipated future price path, which I project based on current market dynamics and patterns. This projection outlines a potential trajectory we will monitor closely as price develops.
A strong engulfing bullish candle formation above the 281 pivot (🔵) would signal significant bull strength and confirm a strong upward momentum.
A confirmed breakout above the monthly resistance level (🔴) would be a critical bullish signal. initiating further long positions upon a successful retest of this breakout level.
My primary accumulation zone for potential entries is identified in green (🟢 dotted), ranging between 241 and 212. This range represents an area where I anticipate favorable risk-reward for entry.
Target & Time Horizon:
While precise timing is always challenging, I estimate the projected target up to 100% ( above in the white dotted line) could be reached around Q2 2026 or before as markets perform.
Disclaimer:
This analysis represents a personal projection
based on current market observations.
Trade Safely,
Always DYOR
#हिन्दुस्तान कॉपर लिमिटेड
#indianeconomygrowth

RAIN Industries Swing IdeaRain Industries has given Multiyear breaks out with spike in volume we can expect a good upside movement in the stock.

Nifty Closes Below 25,000 — What Lies Ahead?The Indian market's recent uptrend appears to be losing momentum, as the benchmark Nifty index extended its decline for the third consecutive week, ending just below the important 25,000 mark.
This pullback has been largely driven by weakness in the Financial and IT sectors, with major players like NSE:TCS , NSE:HCLTECH , and NSE:AXISBANK posting disappointing earnings.
From a technical perspective, the index is now approaching a key support zone near 24,900. A decisive break below this level could open the door for a further slide towards 24,500.
Open Interest (OI) data reinforces this view, with the 25,000–24,900 zone seeing the highest put writing, marking it as an immediate support area. On the upside, strong call writing at 25,100 and 25,200 on Friday suggests these levels will act as immediate resistance.
Given the current structure, the outlook for the coming week remains neutral to bearish.
Traders are advised to stay cautious, manage risk effectively, and keep a close watch on these crucial levels.

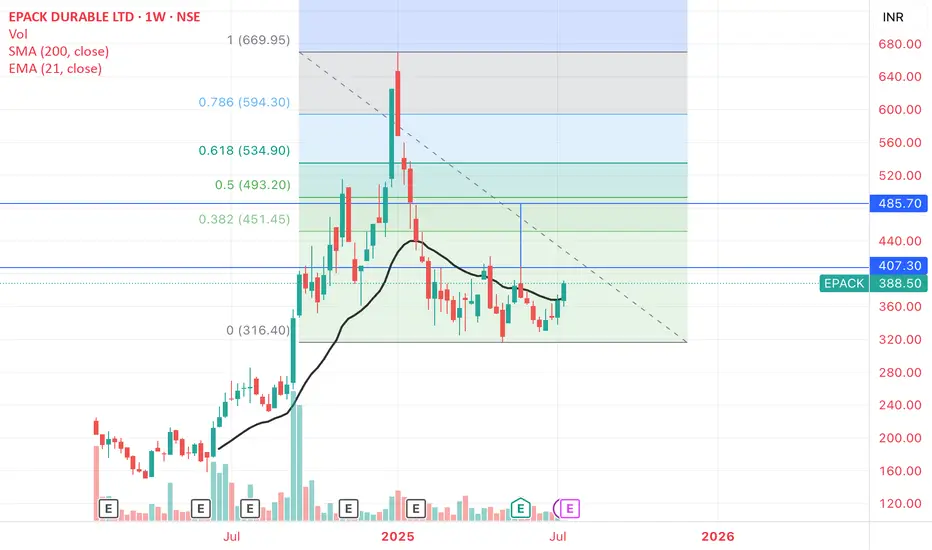
E-PACK_ Potential Double Bottom and TargetsE-PACK DURABLE: Potential Double Bottom with Resistance 407-410 zone.
Weekly close above it - Target 480-490 , that is also the 50% retrace Fib Level of the entire fall from the peak
Weekly close and support held at 407-410 matters
SWING IDEA - NEULAND LABNeuland Lab , a niche API manufacturer with strong export presence and leadership in complex molecules, is offering a technically strong swing trade opportunity from key support levels.
Reasons are listed below :
11,500 zone acting as a crucial support area
Formation of a hammer candle on the weekly timeframe, signaling potential reversal
Reversing from the 0.618 Fibonacci retracement zone – the golden pocket
Taking support at the 50-week EMA , holding long-term trend structure
Target - 14900 // 17600
Stoploss - weekly close below 10215
DISCLAIMER -
Decisions to buy, sell, hold or trade in securities, commodities and other investments involve risk and are best made based on the advice of qualified financial professionals. Any trading in securities or other investments involves a risk of substantial losses. The practice of "Day Trading" involves particularly high risks and can cause you to lose substantial sums of money. Before undertaking any trading program, you should consult a qualified financial professional. Please consider carefully whether such trading is suitable for you in light of your financial condition and ability to bear financial risks. Under no circumstances shall we be liable for any loss or damage you or anyone else incurs as a result of any trading or investment activity that you or anyone else engages in based on any information or material you receive through TradingView or our services.
@visionary.growth.insights

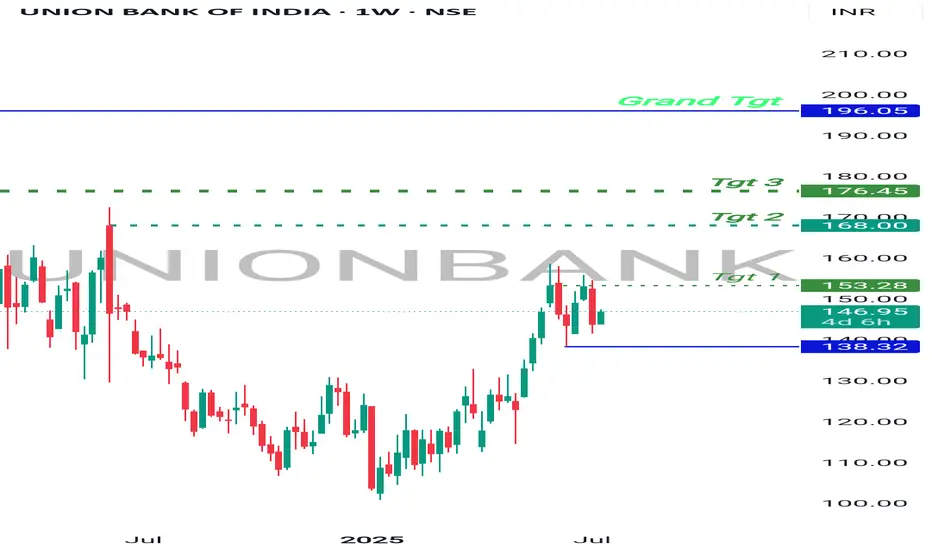
Bullish Bet , UnionBankBanknifty at support.
UnionBank on recent high making sideways moves, which means consolidation.
Once Banknifty Bounce back, UnionBank will break the resistance on weekly and monthly Basis and will start moving higher.
It has higher targets on a short and long term investment.
Good to hold for short term.
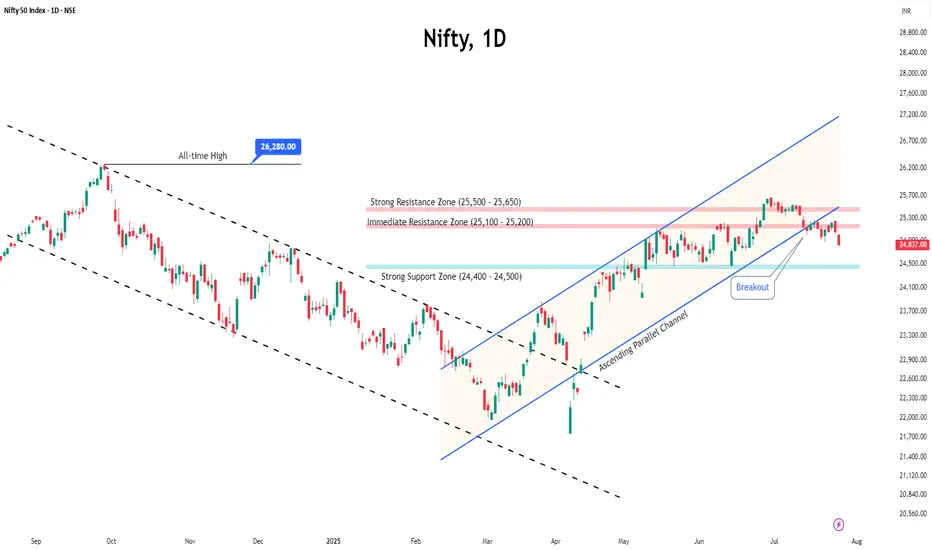
Nifty Dips, Suggests Range-Bound Movement AheadIndian markets ended the week with a decline of nearly one percent, driven by lingering concerns over global tariffs and a weak start to the earnings season.
The 25,500 level has now turned into a strong resistance zone, marked by heavy call writing, while 25,000 continues to act as a solid support level backed by significant put writing.
Given these dynamics, the index is likely to enter a consolidation phase, with upcoming earnings announcements expected to keep sectoral volatility elevated.
VI Stock(India) Looking for bullish Rally! {5/07/2025}Educational Analysis says that VI Stock (India) may give trend Trading opportunities from this range, according to my technical analysis.
Broker - NA
So, my analysis is based on a top-down approach from weekly to trend range to internal trend range.
So my analysis comprises of two structures: 1) Break of structure on weekly range and 2) Trading Range to fill the remaining fair value gap
Let's see what this Stock brings to the table for us in the future.
Please check the comment section to see how this turned out.
DISCLAIMER:-
This is not an entry signal. THIS IS FOR EDUCATIONAL PURPOSES ONLY.
I HAVE NO CONCERNS WITH YOUR PROFIT OR LOSS,
Happy Trading, Fx Dollars.

Adani Enterprises Weekly Chart Analysis: Bullish ScenarioAdani Enterprises Weekly Chart Analysis: Bullish Scenario
-June 23 Weekly candle close above 200EMA(Bullish)
-EMA 9/21 Bullish cross on May 26
-MACD signal line crossing above zero line -Bullish
-If next couple weeks candles close above Support level i am expecting 3070 as next Buyside target(Long)

SWING IDEA - AJANTA PHARMAAjanta Pharma , a mid-cap pharma player with strong branded generics in ophthalmology, dermatology, and cardiology, is showing a compelling swing trade setup backed by a high-probability technical breakout.
Reasons are listed below :
Bullish engulfing candle on the weekly timeframe, indicating reversal strength
2,500 zone acting as a crucial support
Holding above 0.382 Fibonacci retracement level , suggesting healthy correction
Price trading above 50 & 200 EMA on the weekly chart – long-term strength intact
Breakout from narrow consolidation near the 50-week EMA
Target - 3080 // 3400
Stoploss - weekly close below 2415
DISCLAIMER -
Decisions to buy, sell, hold or trade in securities, commodities and other investments involve risk and are best made based on the advice of qualified financial professionals. Any trading in securities or other investments involves a risk of substantial losses. The practice of "Day Trading" involves particularly high risks and can cause you to lose substantial sums of money. Before undertaking any trading program, you should consult a qualified financial professional. Please consider carefully whether such trading is suitable for you in light of your financial condition and ability to bear financial risks. Under no circumstances shall we be liable for any loss or damage you or anyone else incurs as a result of any trading or investment activity that you or anyone else engages in based on any information or material you receive through TradingView or our services.
@visionary.growth.insights

SWING IDEA - JK LAKSHMI CEMENT JK Lakshmi Cement , a key player in India’s cement sector under the JK Group showing strong technical confluence making this a swing-worthy setup.
Reasons are listed below :
Formation of a bullish engulfing candle on the weekly chart, indicating a potential trend reversal
Strong support from the 50-week EMA , reinforcing medium-term trend strength
Breakout from a consolidation range that lasted over a year, suggesting renewed momentum
Inverse Head & Shoulders breakout , a classic bullish pattern
Target - 1000
Stoploss - weekly close below 795
DISCLAIMER -
Decisions to buy, sell, hold or trade in securities, commodities and other investments involve risk and are best made based on the advice of qualified financial professionals. Any trading in securities or other investments involves a risk of substantial losses. The practice of "Day Trading" involves particularly high risks and can cause you to lose substantial sums of money. Before undertaking any trading program, you should consult a qualified financial professional. Please consider carefully whether such trading is suitable for you in light of your financial condition and ability to bear financial risks. Under no circumstances shall we be liable for any loss or damage you or anyone else incurs as a result of any trading or investment activity that you or anyone else engages in based on any information or material you receive through TradingView or our services.
@visionary.growth.insights

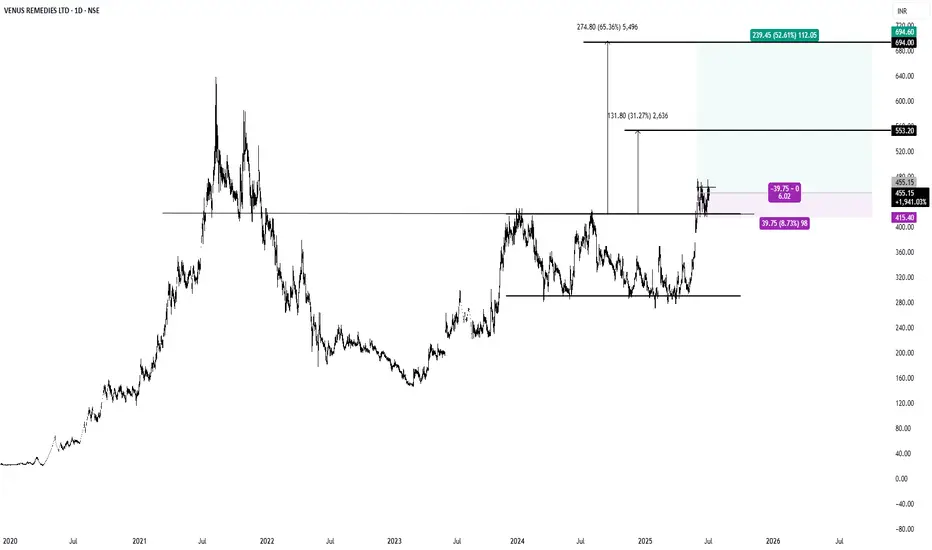
$VENUSREM #INDIA #NSE1. Cup and Handle Break Out.
2. Parallel Channel Break Out.
3.R:R >6 , Tight Stop Loss.
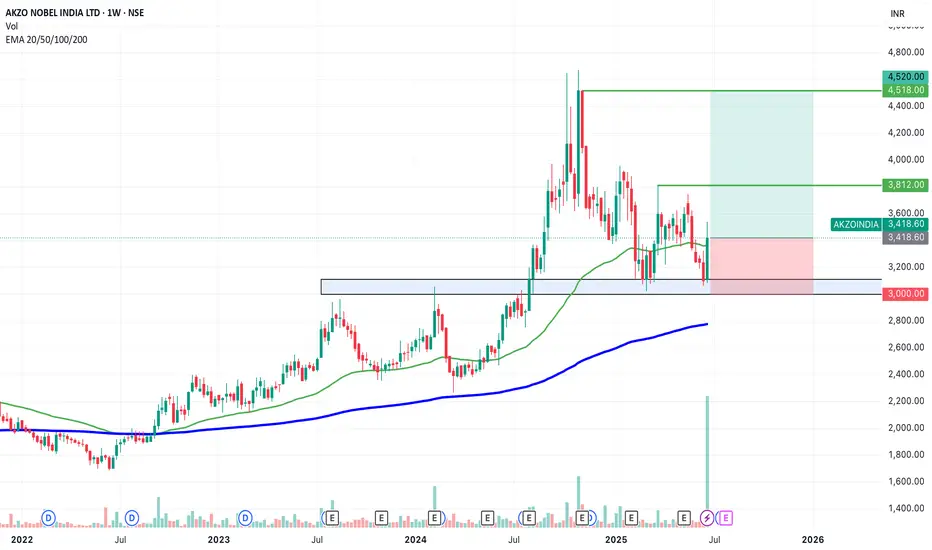
SWING IDEA - AKZO NOBEL INDIA Akzo Nobel India , a subsidiary of the global paints and coatings giant AkzoNobel N.V., is a leading player in India’s decorative and industrial paints market. Known for its premium brand Dulux , the company has strong brand recall, a wide distribution network, and consistent profitability.A strong brand, steady margins, and a bullish chart make this a candidate to watch for a short- to medium-term swing trade.
Reasons are listed below :
Bullish engulfing candle spotted on the weekly timeframe, signaling a potential trend reversal.
Accompanied by the highest-ever volume spike, adding strong conviction to the move.
Price is bouncing off the golden Fibonacci support (0.618), a classic retracement zone where strong reversals often occur.
The level of 3100 acted as a solid support.
The stock is trading above its 50 & 200 EMA on the weekly chart — a sign of long-term strength.
Target - 3812 // 4520
Stoploss - weekly close below 3000
DISCLAIMER -
Decisions to buy, sell, hold or trade in securities, commodities and other investments involve risk and are best made based on the advice of qualified financial professionals. Any trading in securities or other investments involves a risk of substantial losses. The practice of "Day Trading" involves particularly high risks and can cause you to lose substantial sums of money. Before undertaking any trading program, you should consult a qualified financial professional. Please consider carefully whether such trading is suitable for you in light of your financial condition and ability to bear financial risks. Under no circumstances shall we be liable for any loss or damage you or anyone else incurs as a result of any trading or investment activity that you or anyone else engages in based on any information or material you receive through TradingView or our services.
@visionary.growth.insights
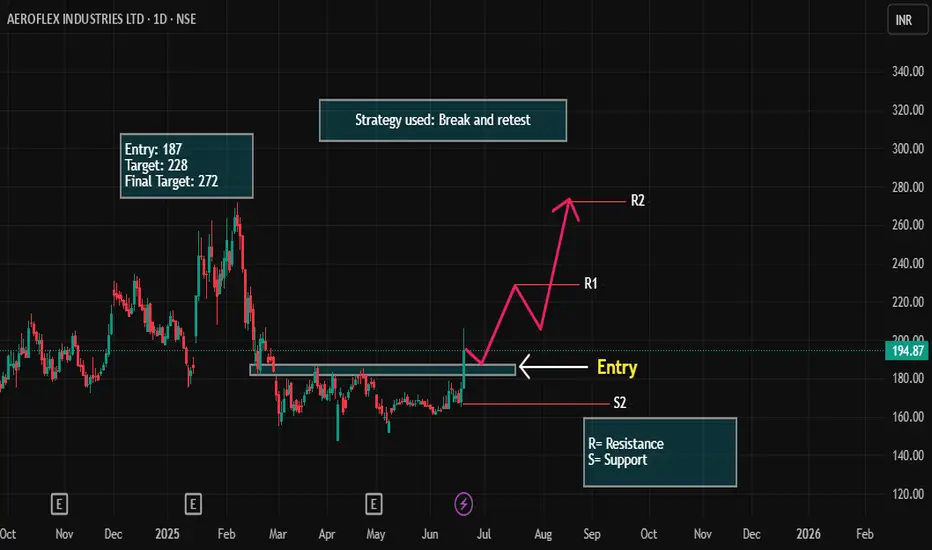
AEROFLEX LONG Setup!Stock: Aerofle (AERF)
Current Market Price (CMP): ₹194
Entry Point: ₹187
Target: ₹228
Final Target: ₹272
Stop Loss (SL): Below Support 2
Trade Setup with Stop Loss:
Entry at ₹187: As mentioned earlier, you plan to enter at ₹187, which is lower than the current market price of ₹194. You're waiting for a pullback to this level, anticipating the stock will rebound from this price and head higher.
Target at ₹228: This is your first price target, where the stock is expected to face resistance. Once the stock hits ₹228, it might experience some pullback or consolidation.
Final Target at ₹272: This is the key level where you're aiming for the stock to reach, assuming the trend continues. ₹272 is your ultimate exit target.
Stop Loss (SL) Below Support 2:
The stop loss is placed below Support 2, which is a lower level of support. By positioning the stop loss here, you're allowing for some price fluctuation, but you’re limiting your downside risk in case the trade doesn’t play out as expected. Support 2 serves as a critical level, and if the price falls below this, it could indicate a reversal or breakdown of the trend.
Why This Setup Works:
Support 2 is your safety net. If the stock breaks below this level, it suggests that the uptrend is invalidating, so exiting with minimal loss is a good risk management strategy.
You're using the break and retest strategy with Support 2 as a critical level to protect against a major downtrend. If the stock holds above ₹187 and moves up to ₹228 and beyond, your risk-to-reward setup is favorable.
KBCGLOBAL Looks bullish!A potential entry is identified at 0.46. The first target is 0.62, representing a +34.78% gain from the entry point. If the upward momentum continues, the long-term target is set at 0.87, offering a total potential gain of +89.13% from the initial entry. This trade presents a strong risk-to-reward profile for both short-term traders and long-term investors. Proper risk management is essential, especially if price action weakens below the entry level.

Trade setup HINDZINCHINDZINC Is approaching a key support level at 440. This level is critical for determining the stock's next move. A breakdown below 440 could signal increased bearish momentum, potentially leading to further downside. On the other hand, if the 440 level holds strong and shows signs of support, it could mark the beginning of a bullish reversal. In that case, there's a significant upside potential, with a possible long-term target around 655. For now, it's important to stay patient and wait for a clear signal—either a breakdown or a bounce from the current level—before making any trading decisions.

IDIA Range Accumulation – Bullish Only With Fundamental TriggerThe stock is currently trading inside a tight range, indicating a phase of consolidation.
📉 Buy Zone: ₹6.38
I’m planning to accumulate if price drops near this zone. From a technical view, it’s a strong demand area. However, for the bullish breakout to sustain, we’ll need strong fundamental support — like earnings, news, or sector momentum.
🔍 If fundamentals align, this could become a long-term multibagger setup.
✅ Strategy:
Wait for ₹6.38 zone
Accumulate small quantities
Hold for long-term with regular news tracking
💬 What do you think?
Would you wait for breakout or buy inside the range?
#TechnicalAnalysis #SwingTrade #LongTermView #SupportZone #BreakoutSetup #StockMarketIndia

Cochin Shipyard – Key Level Retracement & Long SetupCochin Shipyard is perfectly retracing to a key support zone, showing strength for a possible bounce.
🔹 Entry: ₹2149
🎯 Target 1: ₹2543
📈 Potential Gain: ~18.3%
🕒 Plan: Holding position unless structure shifts
This setup aligns with the current trend — looking for a continuation after healthy retracement. Tight stop-loss recommended for capital protection.
💬 What's your view on this trade?

HDFC Accumulation Breakdown Setup?HDFC seems to be building an accumulation range with:
Range High: ₹1955
Range Low: ₹1908
Currently, price is consolidating within this zone. I'm biased to the sell side for now, expecting a potential breakdown below the ₹1908 level.
⚠️ No confirmation yet — it's a “wait and watch” scenario. A strong close below the range low could trigger momentum selling.
💬 What's your view on this setup?

Buy the Dip: Tata Motors Set to Zoom from ₹713 to ₹799!Consider buying Tata Motors stock below ₹713 with a long-term target of ₹799, offering a potential profit of approximately 12%.

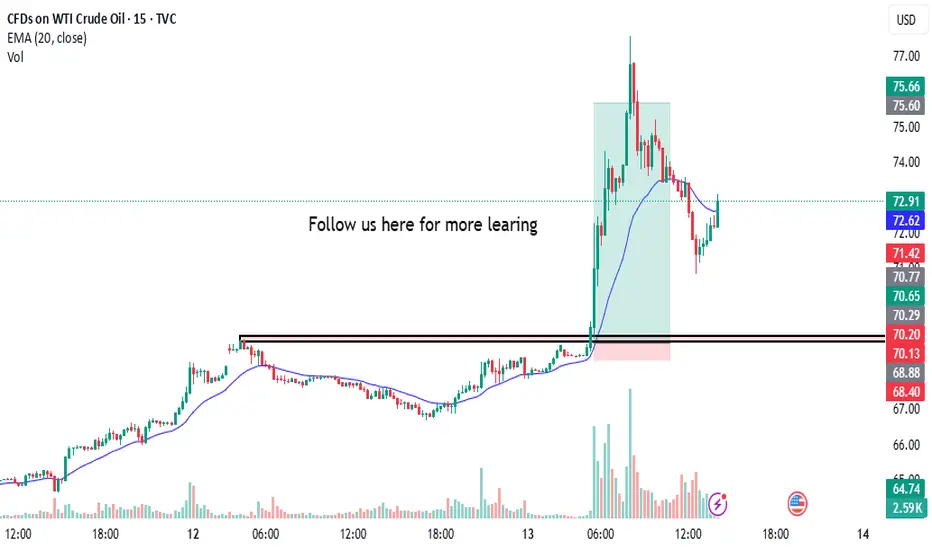
Captures 1:15 in US OIL Today i captures 1:15 in us oil
the annalysis was simple and clean as always i took trade on breakout of zone with proper research & annalysis and booom, as always we got our profit
follow us for more learing here
Trent Ltd: Breakout or Fakeout?Trent Ltd: Breakout or Fakeout? Someone’s positioning — the question is which side.
Trent Ltd remains one of the more resilient players in India’s retail landscape. While broader consumer sentiment remains mixed, the company continues expanding its footprint, especially through its Westside stores and fashion vertical. Recent earnings have been stable, and institutional interest appears to be creeping back in — confirmed by a steady rise in volume.
Technically, we’re at a decision point. Price is testing a major descending trendline drawn from the all-time highs. So far, no breakout — but signs of accumulation are building. All major EMAs (50/100/200) are below the price, putting buyers firmly in control. Volume is rising on bullish candles, with no signs of distribution. RSI is holding above 50, climbing steadily, and showing a healthy impulse without overheating — plenty of room left for upside.
The key setup: wait for a confirmed breakout above the trendline, then a retest, and only after that consider entering. Targets, based on Fibonacci levels, line up cleanly:
tp1: 6337.60 (0.618)
tp2: 7484.65 (1.0)
tp3: 8301.40 (1.272)
Until then — this is a watching game, not a trading one. Momentum is building, the structure is clean — but confirmation is king.
