Equity Research Report – NEWGEN SOFTWARE TECHNOLOGIESShort-Term View: A strong breakout above key resistance at ₹1,100 with volume surge indicates bullish momentum. Price reclaimed the 50 EMA after consolidation. RSI at 60.87 supports strength; next resistance lies near ₹1,193.90.
Long-Term View: Structurally strong after correction. Sustaining above ₹1,020 (50 EMA) may attract fresh buying. Long-term targets can stretch to ₹1,300+ if earnings and demand trends remain favorable.
Conclusion: Bullish momentum likely to continue both short and long term. Watch for volume confirmation and hold above ₹1,100.
For Education Purpose only
Indianstocks

NIFTY Resumes Its Bullish TrendHello traders! Today we will talk about an Indian stock market exchange NIFTY 50, as we see nice and clean pattern from technical and Elliott wave perspective.
As you can see, NIFTY is in an impulsive bullish rise on the weekly basis, which looks like a higher degree wave 3 of an ongoing five-wave bullish impulse by Elliott wave theory.
After recent corrective slowdown in subwave (4), which perfectly tested channel support line and 38,2% Fibonacci retracement, we can now see it extending even higher, ideally for subwave (5) of a higher degree wave 3 that can push the price even up to 28k-30k area this year, just watch out on short-term pullbacks.

Equity Research Report – TIMKEN India Ltd 📌 CMP (May 2, 2025): ₹2,728
🧭 Sector: Industrial Bearings & Motion Solutions
📈 Signal: Breakout from falling channel with strong volume confirmation
🔹 Technical Summary
Breakout Pattern: Price has decisively broken out of a long-term falling channel after a 10-month downtrend.
Volume Spike: Breakout accompanied by significant volume spike (highest in over a year) – strong institutional interest.
Momentum: RSI has broken above resistance line (~55), confirming bullish momentum.
🧭 Trade Setup
✅ Buy Zone (Swing Trade/Positional)
Buy Above: ₹2,750
Target 1: ₹2,900
Target 2: ₹3,050
Target 3: ₹3,280
Stop-Loss: ₹2,490 (just below recent breakout candle)
Timeframe: 2–6 weeks
Risk-Reward Ratio: ~1:2.5 (good for swing setups)
🚫 Invalidation Level:
Breakdown and close below ₹2,490 on weekly timeframe.
For Education purposes only

Will NIFTY50 fall?Regarding NIFTY 50 Index
my expectation was that after a small growth, the g-wave from the diametric will be completed, then the price correction will start and the reason for it can be anything, definitely if the correction starts, the reason will be the war between India and Pakistan.
Normal:
The correction can continue up to the range of 23209-23456 and after spending the required time, start moving up. If this range is broken, the correction can end in the range of 22300-22700.
Pessimistic:
If the end of the wave-(D) is broken strongly, the upward movement that was formed from 21740 to 24593 will be considered as an X-wave and the wave-(D) will turn into a double pattern. Although the upward movement that formed from 21740 to 24593 does not have all the conditions of the X-wave, but when the market is not normal, we need to be a little flexible in our analysis.
What will be the second pattern of the double combination?
Usually, after the diametrics, the second pattern tends to be a neutral triangle or a contracting triangle or a reverse contracting triangle. But I will not comment on it now and wait for a few waves of the second pattern to form, then we can predict the pattern with more probability.
Good luck
NEoWave Chart

POWERGRID – Breakout Setup with Volume Spike📍 Entry Zone: ₹310.10 – ₹311.10
🎯 Target: ₹330.00
🛑 Stoploss: ₹302.00
📈 RSI has crossed above 60, volume confirms breakout momentum (🔵 arrow), and price is supported above key EMAs.
🔍 Strong bullish structure with clear higher lows and a clean breakout candle. Momentum shift confirmed with increasing volume.
For Education Purposes Only

Equity Research Report – Polycab India Ltd.✅ Buy Levels
Buy Above: ₹5,800 (post breakout confirmation)
Ideal Entry on Dip: ₹5,765–₹5,785
🎯 Targets
Timeframe Target 1 Target 2 Target 3
15-min ₹5,870 ₹5,950 ₹6,070
1-hour ₹6,070 ₹6,220 ₹6,427 (Fib 61.8%)
🔻 Stop Loss
Intraday SL: ₹5,720
Positional SL: ₹5,650 (below trendline support and 20 EMA)
For Education purposes only

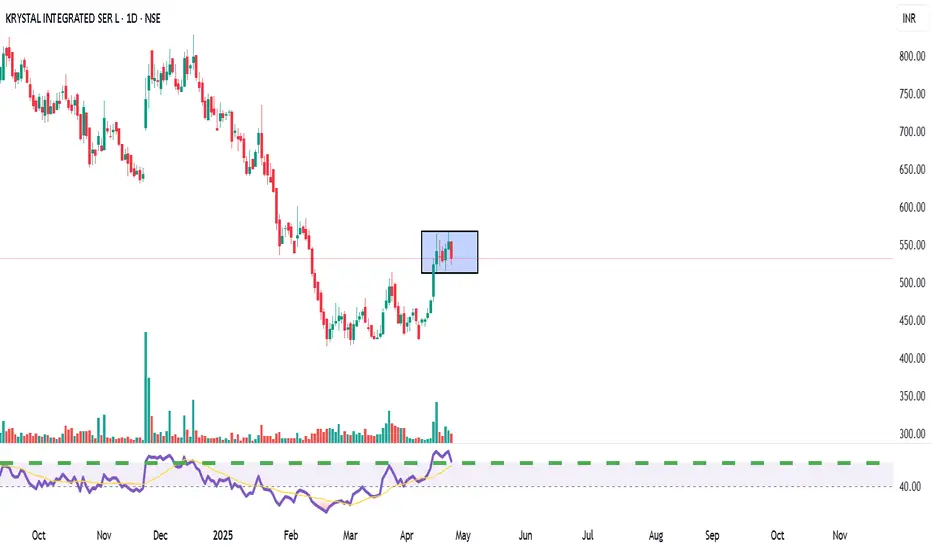
KRYSTAL Integrated Services LtdTechnical View: KRYSTAL is consolidating between ₹520–₹550 after a rally from March lows. A breakout above ₹560 could target ₹600+, while a dip below ₹500 may weaken momentum. RSI shows moderate bullishness.
Fundamental View: FY24 revenue grew ~44% YoY to ₹981 Cr; net profit rose ~26% to ₹48 Cr. ROE ~18%, ROCE ~20%. Recently secured a ₹349 Cr 3-year contract from Tamil Nadu Medical Services.
Action Plan:
Short-term: Buy above ₹560, target ₹600.
Long-term: Attractive valuation; accumulate on dips ₹450–₹500 zone.
DIVISLAB | Strong Volume Breakout from Multi-Month Resistance 📈 Trade Recommendation:
✅ For Intraday:
Buy Above: ₹6,250 (on sustained breakout and volume)
Intraday Target: ₹6,350–₹6,420
Stoploss: ₹6,180 (below breakout zone)
📊 For Short-Term (1–2 weeks):
Buy on Retest: ₹6,200–₹6,250 (ideal risk-reward)
Target 1: ₹6,500
Target 2: ₹6,750
Stoploss: ₹6,050 (below retest support)
🔍 Technical Highlights:
Volume surge confirms breakout strength
RSI breakout above 70 indicates strong bullish momentum
Past resistance zone now acting as support on retest

OFSS Weekly | Bullish Harmonic Reversal & RSI Breakout | Short-T📈 Swing Trade Recommendation (Short-Term):
Buy Zone: ₹8,600–₹8,750 (on dips or on strength)
Target 1: ₹9,300 (initial resistance and round number)
Target 2: ₹10,200–₹10,500 (next harmonic resistance zone)
Stoploss: ₹8,050 (below recent swing low)
🔍 Technical Highlights:
Bullish Harmonic Structure forming with strong reversal from "C" to "D".
Volume breakout supports the current leg of momentum.
RSI bullish divergence and breakout confirms potential trend reversal.
For Education purpose only

Waaree Energies Ltd (WRTL)🛒 Buy Recommendation
Buy Zone: ₹2,180–₹2,230
The stock is trading close to a support zone near the 23.6% Fib level (₹2,305) and trying to break out of the falling trendline.
RSI has bounced from the oversold region and is near 50, indicating a possible reversal.
🎯 Targets (Short to Medium-Term)
Target 1 – ₹2,585 (38.2% Fibonacci level)
Target 2 – ₹2,810 (50% Fibonacci level)
Target 3 – ₹3,036 (61.8% Fibonacci level – major resistance)
Swing Target – ₹3,766 (100% Fibonacci level – recent high)
🛑 Stop Loss
SL: ₹2,050 (Below recent swing low & below trendline support)
Risk is around ₹180 from entry; ideal for a reward of 1.5x–3x on targets.
🔎 Additional Technical Signals
Volume: Increasing volume on green candles shows buying interest.
RSI: Forming a bullish divergence and heading upward.
Breakout Point: A daily close above ₹2,305 would confirm a breakout of the trendline and strengthen the bullish case.
for educational purposes only

ONE POINT ONE SOL LTD bullish reversal pattern✅ Trade Setup (Swing Trade)
📌 CMP: ₹62.21
🟢 Entry (Buy Zone): ₹60–₹63
🎯 Targets:
Target 1: ₹69.80 (Fibo 0.382)
Target 2: ₹78.50 (Fibo 0.5)
Target 3: ₹87.30 (Fibo 0.618)
🛑 Stoploss: ₹55 (below wedge breakout and recent support)
⚖️ Risk-Reward Ratio:
Entry: ₹62 | SL: ₹55 | Target 1: ₹70 → ~1:1
For higher targets, risk-reward improves to 2:1 or more.
for educational purposes only

ICICI Prudential Life – Turning the Corner?After months of steady decline inside a falling channel, ICICI Prudential Life is showing early signs of reversal. The stock has recently broken out of its channel with a strong bullish weekly candle, closing at ₹571.70 with a +4.5% gain. Volume is picking up, and RSI is curling up above 40 with a bullish divergence—indicating momentum is building. Price is now near a key resistance zone (~₹590–₹610); a clean breakout here could confirm trend reversal.
📊 Financial Snapshot
Net Premium Income: ₹10,169 Cr vs ₹9,465 Cr ⬆️
PAT: ₹226 Cr vs ₹221 Cr (flat YoY)
VNB Margin: Healthy at 26.7%
Embedded Value: ₹47,020 Cr
Solvency Ratio: Strong at 211%
AUM: ₹2.88 Lakh Cr
💡 Why Consider Buying?
Reversal setup after long correction
Attractive risk-reward near base
Steady premium growth, strong solvency
Long-term growth play on India’s underpenetrated life insurance sector
🚫 Risks / Why to Wait:
Resistance at ₹590–₹610 still intact
PAT growth has been flat
Sector sentiment can be sensitive to interest rate trends
🎯 Trade Setup:
Buy Zone: ₹565–575
Target 1: ₹610
Target 2: ₹660
Stop Loss: ₹540
for educational purposes only

Nifty outlooks for next week and overall draw on liquidityExpecting all out bullishness on Nifty 50 Index. 25500+

Nifty Yearly Lows in Place. Time for recovery towards 25000Massive meltdown towards the sellside. Time for all out displacement towards the internal buyside. I feel the yearly lows are in place. Best time to invest for SIP and mutual funds

levels to watch It's clear that analysts, the media, and others who seek the spotlight often try to explain why the markets moved in a certain direction. The irony, however, is that these explanations usually come after the market has already moved, making it obvious that they’re just linking the moves to some news event.
If you pay close attention, you'll realize that technical tools can provide valuable insights ahead of time, helping you predict how the market will behave and where it’s likely headed. For those who’ve read my past articles, you’ll notice I’ve already highlighted key levels for the Nifty index and the potential targets it could reach.
Whether there were tariffs or not, the market was bound to drop. But as I pointed out, the crash is being blamed on the tariffs.
As long as the markets remain below the 24,000 level, we can expect them to target 21,800 and possibly even lower in the coming weeks.
I had booked profits for some of my stocks around the 21,800 level and re-entered short positions at 23,800.
Indian market cannot go bullish until RUPEE becomes strong !a lot of analysts saying Dollar is going to week vs rupees but seeing technical chart, dollar is traded above 50 EMA and never come to touch since October. currently Dollar completed Symmetrical Pattern showing any upcoming momentum may happen, either bullish or bearish is just could say after seeing breakout/breakdown this pattern. To gain strength in Rupee it is required to give USDINR 50EMA breakdown or bearish crossover. Till then the rupee will remain weak and Indian stock market also.

Infosys Vs Nifty IT The markings on the chart are based on the Elliott Wave theory.
The IT index has lagged in strength over the last 1+ year and now seem to enter the next wave C down. While the index made a new high, the internal moves are corrective and divergent on the RSI which makes it a better wave (B) candidate.
The next few weeks should be a sharp fall in the IT stocks as wave (c) tend to be quick and less time taking.

a Sign of Hope..Continuously making LH LL (Downtrend).
Currently at an Important Support level.
Double Bottom formation around 1200.
Bullish Divergence is there on Daily TF, which is a Positive Trigger.
However, the stock will reverse its trend once it will Cross & Sustain 1465 atleast.
& if this level is Crossed & Sustained, we may witness 1700 - 1730 initially.
On the flip side, breaking the Current Level (around 1200), will bring more selling pressure
& we may witness 1000 - 1040.

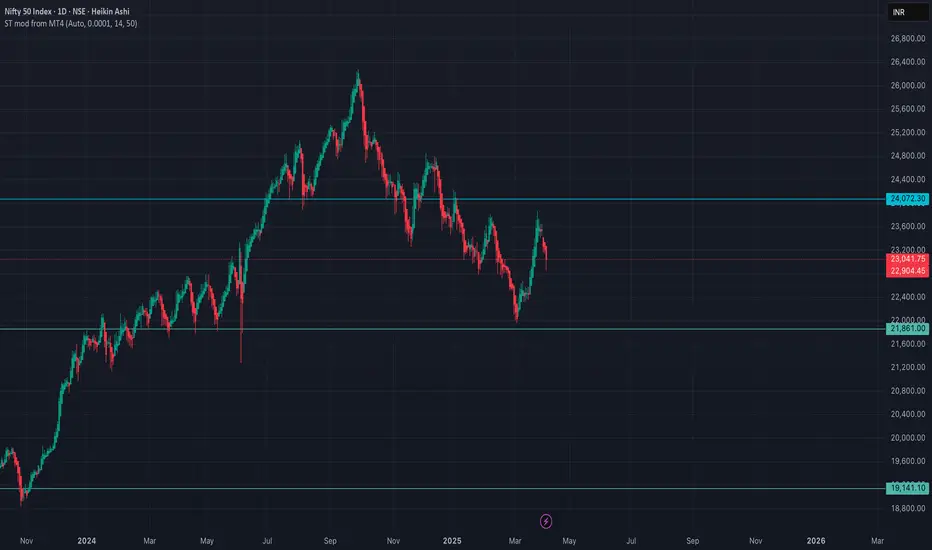
NIFTY still bearish targeting the 1W MA100 at 22250.The Nifty 50 Index (NIFTY) has been trading within a Channel Down pattern, with its latest Lower High being exactly on the 1D MA50 (blue trend-line). This caused the rejection that initiated the current Bearish Leg.
As we've already completed a 1D Death Cross, the last two times we saw a similar Channel Down was during December 2022 - March 2023 and October 2021 - June 2022. Both of those patterns hit the 1W MA100 (red trend-line) before forming a bottom and rebound.
The March 2023 in fact, was priced exactly on the 0.5 Fibonacci retracement level. With their 1D RSI sequences also identical, we expect the bearish trend to continue for around another 30 days before the Channel Down bottoms on the 1W MA100 - 0.5 Fib cluster. Our Target is 22250.
-------------------------------------------------------------------------------
** Please LIKE 👍, FOLLOW ✅, SHARE 🙌 and COMMENT ✍ if you enjoy this idea! Also share your ideas and charts in the comments section below! This is best way to keep it relevant, support us, keep the content here free and allow the idea to reach as many people as possible. **
-------------------------------------------------------------------------------
💸💸💸💸💸💸
👇 👇 👇 👇 👇 👇

HBL ENGINEERING- BEAR CASE: POTENTIAL H&SHBL ENGINEERING- Potential H&S Forming, bear case scenario
Break of the crucial support decisively( full candle close) can test the low wicks earlier tested twice at 360-370 levels also.
Keep a watch on the results also.

HBL Engineering- Possible DOUBLE BottomPossible Double Bottom formed by HBL Engineering, major support held 515-520 on the weekly chart. Breakout above its 726 resistance with a clear close above should target 1000 gradually( the break out target)

KPIT Tech- Support held, upmove in progressKPIT TECH- held the support zone perfectly well, next upmove faces resistance at zones mentioned, 0.5 FIB level is the key now.
Take gains if entered short term trades at levels.

Inverse head and shoulder pattern monthly chart Just for education purpuse
Its look like inverse head and shoulder patern on monthly chart
thanks
