TRADE SETUP_ A 20% up move in BOBThe Stock is looking like coming out from wave 4 correction and is in the right demand zone, ready for its next move up towards 225 zone(25% from CMP).
It should also be noted that the Bank had announced its results on 4th of November and posted solid Stand Alone Net Profit of Rs.42.53B vs Rs.33.13B(YOY).
190 is the crucial support for the stock and 185 can be used as a SL.
CMP - 191.25
SUPPORT - 190
SL - 185-186
TARGET - 220-230
Indianstocks

20% upside potential in Kotak bankThe large cap bank set out an impulse in march 2023 and since then has been in a complex corrective mode and retraced more than 705 of the wave i. This provides a good entry and a good risk/reward from CMP to enter the stock with a good risk reward(5% vs 23%).
sl 1635
target 2110

Redington_65% upside potentialRedington or Redington Group is an organization of companies offering services and products in the field of mobile handsets, mobile accessories, information technology services, artificial intelligence, big data analysis, 5G communications, Internet of Things and supply chain management.
The company looks all set to move into a wave 3 structure now which can take the price from current 154 level to 250(a handsome 64% return).
The stock had completed its last impulse move in Dec.2022 and that was the Wave 1 high.
From Dec2022 till the most recent low of oct.2023, the stock was in a 10month long corrective wave 2 pattern.
The correction now seems completed(structurally all legs achieved) and therefore the stock should now look to advance towards the projected wave 3 target of 250 going forward into 2024.
Note*- This chart is for educational purpose only.

wave III of 3 in CARYSIL...upside potential of 25%Carysil Limited, together with its subsidiaries, manufactures and trades in quartz kitchen and stainless steel kitchen sinks, bath products, tiles, kitchen appliances, and accessories in India.
The stock is seen making impulse waves to the upside since Jan 2023.
It made the first impulse (wave 1) from Jan. - April 2023. Wave 3 seems to have started off in May 2023 and is likely getting extended.
Wave I of 3 was formed between May and July 2023 and then there was a 75% retracement of wave I from July-oct.
Wave III of 3 has now kicked off and volume too is picking up. The projected target for this wave should be the 850-870 zone
SL 650
CMP 696
Target 860

A new 40% wave towards 900 in HDFC LIFEHDFC LIFE INSURANCE COMPANY rallied up from 457.8 to 690.85 in a wave 1 structure beginning in march 2023 ending in July.2023.
However from July the stock got into a wave 2 correction and seems to have ended the very same in Oct. end.
The stock ended the wave 2 correction(technically a "flat" according to Elliot wave theory) at a very crucial support/resistance zone of 600 that is relevant since May.2022.
Coming to the very recent price action of the stock, the stock traded in a very narrow range for 7 days(613-626)between 1st Nov. till 9th Nov. and is now looking to break out of this range.(Generally referred to as NR7 breakout.)
The 600 level has worked as a very good support for the stock and therefore SL can be placed below it at 595-597 to try and catch the new upcoming wave that can give 40% returns going forward into 2024.
Note*- kindly try to understand the business model and key fundamentals of a company before making any investing decisions.

IDFC Ltd - Value pick available at very attractive valuationIDFC Ltd - CMP-117.05, Target-200, SL-75
Infrastructure Financing, Market Cap 18,735+ Cr
Available at very attractive valuation
PE 4.52, PB 1.55, Dividend Yield 10.25
FIIs holdings 20.03%, DII 32.10%

Brightcom Group, Debt free available at very attractive ValueBrightcom Group Ltd - Levels on the chart CMP-16.80 Target-32,50 SL-12
Sector IT, Digital Eco-system , IoT - Market Cap 3390+ Cr
Available at very attractive valuation - Debt Free company
PE 2.4, PB 0.46, Book value/share 36.28
FIIs Holding - 9.5%, Mutual funds increasing holdings
Clients - leading blue chip advertisers

TRADE SETUP_ 10% upside for COROMANDELThis specialty chemical stock is seen in a beautiful Elliot wave structure since the Jan 2023 and has outperformed not only its peers but also major Indian Indices.
The stock recently had a steep and swift decline in October. This very declined was in fact the wave iv of wave 3 and now the stock has kicked off in the Wave v of Wave 3 structure.
It would be wise to wait for a small dip in the stock(towards 1070-1080) to make an entry and ride next wave up towards the 1215 zone.
Note*- Please do own your own research and analysis before taking up any financial positions.

NIFTY Excellent long-term buy opportunity.Nifty 50 Index (NIFTY) has been trading within a long-term Channel Up pattern since the June 17 2022 low and recently has found itself on a correctional 1.5 month wave under the 1D MA50 (blue trend-line) towards the 1D MA200 (orange trend-line).
Last week the 1D RSI breached the 30.00 oversold mark and immediately rebounded. It hasn't been that low since June 17 2022, which was the very start of the long-term Channel Up. As a result, those are indeed technically underpriced levels and this Channel Down correction on the RSI resembles the bearish leg of August - September 2022, which stopped before the 0.5 Fibonacci retracement level and resumed the Channel Up uptrend.
As a result, if the 1D MACD forms a Bullish Cross (as October 17 2022), it will confirm the oversold bullish reversal signal of the RSI. As long as the 0.5 Fibonacci level (18530) holds, we are bullish on the index, targeting the -0.236 Fib ext at 21000 (which is where the December 01 2022 Higher High was priced). It has to be mentioned that the symmetry of the Channel Up rallies is indeed quite strong.
-------------------------------------------------------------------------------
** Please LIKE 👍, FOLLOW ✅, SHARE 🙌 and COMMENT ✍ if you enjoy this idea! Also share your ideas and charts in the comments section below! This is best way to keep it relevant, support us, keep the content here free and allow the idea to reach as many people as possible. **
-------------------------------------------------------------------------------
💸💸💸💸💸💸
👇 👇 👇 👇 👇 👇

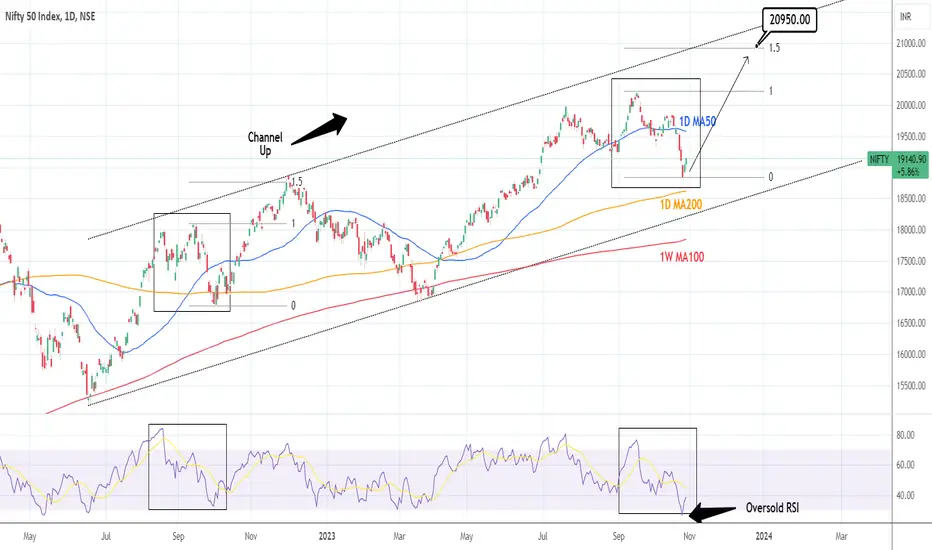
NIFTY Shifting to a long term buy.Nifty 50 turned oversold last Thursday on the 1D technical outlook and that attracted investors which restored the timeframe from oversold to just bearish (RSI = 38.950, MACD = -141.600, ADX = 34.223). This shows considerable buying strength, a little over the 1D MA200, a support level that is holding since April.
The price action look very much like August-September 2022, when again a nearly oversold 1D RSI on the 1D MA200, kickstarted a rise to a HH on the 1.5 Fibonacci level. We see a similar trend emerging, so take this opportunity to enter in its start and target again the 1.5 Fib (TP = 20,950).
## If you like our free content follow our profile to get more daily ideas. ##
## Comments and likes are greatly appreciated. ##
JSWENERGY will break 700 days resistance 🤥Will it break high level support 📌 to reach new high in powe sector
Or it get rejected to white 🐻❄️ line 📌 below box 😂 huge crash
Let's watch 👀 stay with me 😉 i will update it 😜
Boost 🚀 post so u get updated on post when I am updating everything

TATA Consumer ProductTATACONSUM - The idea is based on the Elliott Wave Theory. A five wave pattern has clearly completed on the stock with an ending diagonal in wave 5th.
This suggests that a correction will take place to 50% to 61.8% fibonacci level. So a correction towards 800 is likely in the coming weeks. As markets are also weakening due to global concerns, this is where technical and fundamental analysis are forming a balance.

EMUDHRA SWING TRADE 15% 🚀oct 18
swing trade perfect symmetrical triangle long term opportunity for upside take trade after breakout from the trendline according to own risk this is not call just a analysis.
when nifty turns bullish take trade

NSE:Lupin -trend change on card???
NSE:LUPIN
Lupin Limited is an India-based pharmaceutical company. The Company develops and commercializes a range of branded and generic formulations, biotechnology products, and active pharmaceutical ingredients (APIs) in over 100 markets in the United States, India, South Africa, and across the Asia Pacific, Latin America, and others. It offers vitamins, minerals, supplements and neurological products. It has presence in the cardiovascular, dialectology, asthma, paediatrics, central nervous system, gastro-intestinal, anti-infectives and nonsteroidal anti-inflammatory drug therapy segments. Its complex generics portfolio includes Filgrastim, Peg-Filgrastim, Etanercept and Albuterol, and others. Its biosimilar products include Filgrastim, Peg-Filgrastim and Etanercept. Its specialty products consist of Solosec and NaMuscla. Its over-the-counter products include Softovac, Lupizyme, Aptivate, Lupisafe, Be One, V-Bath, and others. It supplies APIs for anti-retroviral, anti-malarial and others.
Disc: Invested, please do you own research

Focusing on IRCTC after a long time Finally the IRCTC is in a good upward trend and we will see a good response of news in IRCTC very soon.
1- A long old uptrend line is following and giving good support to this new uptrend.
2- Now the downtrend is over for sure.
3 - For around 2 trading days there will be more consolidation but don't be surprised if the 760+ target is achieved in this month .

IIFL FIN Long idea another longer term pick. ive outlined 3 zones where demand can come in , buy at these 3 prices in 3 lots . 575 , 555 and 535 . sl below 495 FOR LONG TERM .

ASIAN GRANITO INDIA | DOWN TREND BREAKOUT PATTERNDOWN TREND BREAKOUT STRATEGY
Entry Price - 80₹
SL - 30₹
Targets - 130,200,300,390+
In this channel, I share my expertise in trading strategies, technical analysis, and market trends to help you make informed decisions in your trading ventures.
Stay tuned for daily updates, in-depth market analyses, and real-time trading scenarios to witness firsthand how we transform from Zero to Hero in the trading world. My Only aim is to empower you with the knowledge and skills necessary to navigate the complexities of the financial markets successfully.
Disclaimer - All information on this page is for educational purposes only,
we are not SEBI Registered, Please consult a SEBI registered financial advisor for your financial matters before investing And taking any decision. We are not responsible for any profit/loss you made.
Request your support and engagement by liking and commenting & follow to provide encouragement
HAPPY TRADING 👍

GVK POWER & INFRA | BEST PENNY STOCK TO NOWEntry Price - 9₹
SL - 4.5₹
Targets - 20,27,40,53,90+
In this channel, I share my expertise in trading strategies, technical analysis, and market trends to help you make informed decisions in your trading ventures.
Stay tuned for daily updates, in-depth market analyses, and real-time trading scenarios to witness firsthand how we transform from Zero to Hero in the trading world. My Only aim is to empower you with the knowledge and skills necessary to navigate the complexities of the financial markets successfully.
Disclaimer - All information on this page is for educational purposes only,
we are not SEBI Registered, Please consult a SEBI registered financial advisor for your financial matters before investing And taking any decision. We are not responsible for any profit/loss you made.
Request your support and engagement by liking and commenting & follow to provide encouragement
HAPPY TRADING 👍

HDFC Bank about to BreakOutThe idea here is about HDFC Bank.
Mentioned below are the points to be considered
Points as per TA on a Daily & 4H Chart:
1. Awaiting break out of Falling wedge.
2. Butterfly Pattern completed with entry point confirmed.
3. Waiting for close above 20 EMA = 1550 on 1D chart.
4. RSI is at 44.30 on a Daily Chart.
5. MACD crossed above signal line on 11th Sept 2023.
6. Hull Moving Average is a Buy Signal on Daily & weekly chart.
7. Price may retest the breakout point.
Projected target as per Butterfly Harmonic pattern provided in the chart.
Stop Loss: provided on chart.
Disclaimer: “The above is an idea only and not any kind of financial or investment advice. So please do your own DD (Due Diligence) before any kind of investment”.
Cheers.

Time to buy RamcoCemThe stock has breached its first resistance, which now acts as a support. Entry now gives good risk-to-reward ratio. Safe trade for the short term
Entry - 988-992
SL - 936
Target -1120

COULD INDIA BE THE SAVIOR OF THE USD’S DOMINANCE?COULD INDIA BE THE SAVIOR OF THE USD’S DOMINANCE?
The BRICS alliance aims to dethrone the US dollar’s global supremacy.
India’s rapidly growing economy has led to speculations about its potential role in this shift.
Despite being a BRICS member, India maintains strong economic ties with the U.S.
In the dynamic landscape of global finance, where the BRICS alliance is sharpening its talons, aiming at the soft underbelly of the US dollar’s supremacy, India emerges as a beacon of hope for the greenback.
While the BRICS coalition might assume they have the unwavering support of all its members in their quest to topple the dollar, India’s economic trajectory and diplomatic allegiances paint a different picture.

DWARIKESH SUGAR - SWING TRADING FOR 10-15 DAYS" PARALLEL CHANNEL BREAK OUT "
High Volume Based
Entry level - 98-100
SL - 90 (with previous candle below level)
Targets - 107,113,118+
Market Capitalization of Dwarikesh Sugar stock is Rs 1,923.50 Cr.
#DWARIKESHSUGAR
Disclaimer - All information on this page is for educational purposes only,
we are not SEBI Registered, Please consult a SEBI registered financial advisor for your financial matters before investing And taking any decision. We are not responsible for any profit/loss you made.
Request your support and engagement by liking and commenting & follow to provide encouragement
HAPPY TRADING 👍

