NTPCwait for the support at the trendline and breakout the upper trendline. Follow and give a comment or like ..
Indianstocks

Trident LTDLargest Manufacturer of terry towels in the world. World’s largest wheat straw-based paper manufacturer, and one of the major bath linen providers in the US Forward & Backward integration of operation.
Trident is the second-largest player in home textiles and the third-largest yarn manufacturer in India.
The company has a presence in over 150 countries around the world, with marketing offices in Chandigarh, Bhopal, Gurugram, New Delhi, and Mumbai, and overseas operations in New York, USA, Dubai, and UK.
The company launched ‘Vision 2025’, a plan for coordinating Group efforts to improve the company's positioning across all business verticals. Its goal is to reach Rs 25,000 crore by 2025 with a 12% increase in the bottom line. It also aims to establish Trident as a national brand and digitalise it by completing the smart manufacturing or Industry 4.0 journey
Geographical Split FY22
India: 32%
USA: 44%
Rest of World:24%
DISCLAIMER - IT'S MY STUDY PONTS NOT ANY RECOMMENDATION. THIS IS ONLY FOR STUDY PURPOSE.

HDFCBANK - Bearish Cycle HDFCBANK - Elliott Wave Theory.
The price seemed to have made a corrective pattern which suggests another bearish wave. Invalid level remains at the previous high.

NIFTY - Elliott Wave ViewThe idea is based on the Elliott Wave Theory.
Nifty has made 5 waves down (Impulse 1), and could start moving downwards again after a small correction (50-60%).
Long Term View:
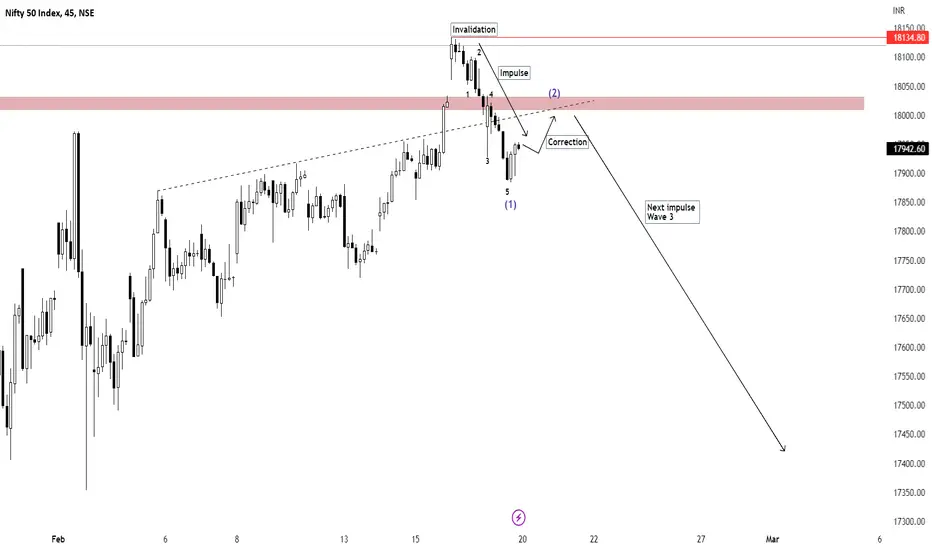
NIFTY - Bearish Market ViewThe idea is based on the Elliott Wave Theory. The current upward momentum is very low and the price is moving in a corrective structure. A downward move is likely from the current resistance zone (or a possible likely scenario with 61.8 fib correction).
A move over 18480 invalidates this idea.

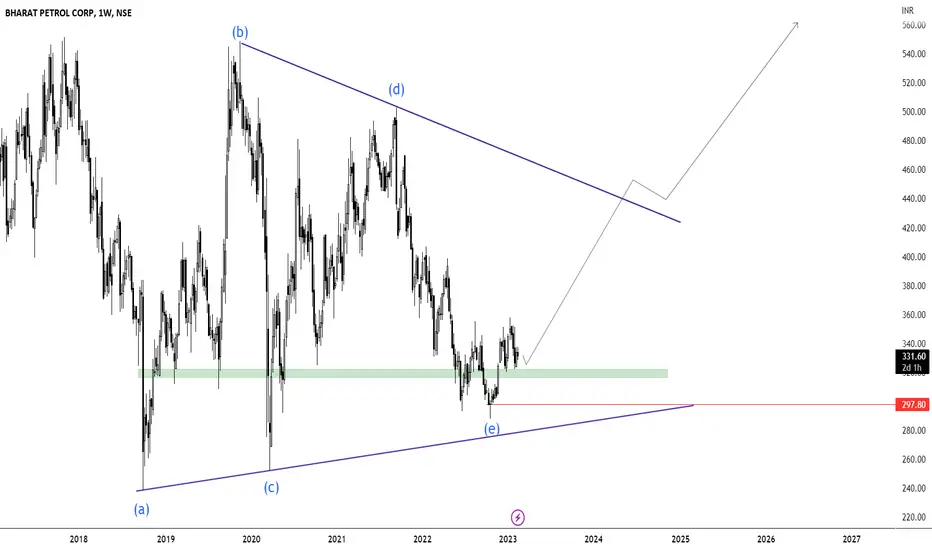
BPCL - Bullish CycleBPCL - Elliott Wave View.
Pattern suggests a triangle formation, which means a bullish scenario is likely from this level. A move below 300 would be an invalidation to this idea.
NIFTY ANALYSIS - 15/02/2023Buy Above - 17960
SL - 17920
Targets = 18020,18080,18140
Sell Below - 17900
SL - 17930
Targets - 17860,17800,17780
Trade Safe, Strictly follow your STOPLOSS
Happy Trading Guys

MRF - Elliott Wave ViewMRF - Daily Chart based on the Elliott Wave Theory.
As long as the triangle stands valid, the price should correct more downwards. Correction could make further extensions if the next resistance level is broken.

TATA Consumer ProductsThe idea is based on the Elliott Wave Theory. The price is still correcting and will extend to 100% of wave X to 595. Below that level, further extension could be towards 450-470.

KOTAK MAHINDRA BANKThe stock is currently making a corrective structure and is likely to extend further to at least 61.8 fib. level. 1500 may be a good level to watch; below that we could also see 1420.
This is based on the Elliott Wave Theory.

RELIANCE - Elliott Wave ViewRELIANCE.
Correction cycle towards 1900 level. Below 1850, could extend towards 1650 level. The stock is forming a WXY corrective pattern.
The analysis is based on the Elliott Wave Theory.

PNB bank bank stock can give you good profit if you hold short time
long trader can enter and wait for 1 to 2 month
intraday can wait for 3rd touch or one more dip

Nifty short term target - 17148, 16800, 16650 Nifty chart has recently broken upward parallel channel (white) and taken support at 200 day EMA.. It has also formed a bear flag. Chart patterns suggest we're looking for a downward momentum short term.
My short term targets are 17148 (Fib measured move), 16800 to 16650 (multi month support zone).
If the 16500 levels get broke NIFTY will test 16049 (gap fill) and 15431 (previous month lows).
Let me know your thoughts in comments.

Quick Intraday Trade in RCF Hourly flag pattern breaks out with volume support. A good quality stock that is likely to see a swing in demand post-budget due tomorrow.
Entry - 122-123
Target - 128/132
Sl - Below 118

Adani Ports: BUY @ 62015 year Chart
In a UP trend Channel.
Great Assets, So Fundamentally and Technically a great company.
Inspite of whats going on, come back and re visit this post after amonth !!!

DAAWAT STRONG MONTHLY BREAKOUTThere is clear breakout in monthly time frame with volume. After that the stock has gone through a good consolidation for three months. Now it's time for another rally if the company posts good results this quarter. One can buy Daawat@CMP with short term targets of 133(19.50%) and 150(36.3%) and a long term target of 194.50(74%). Please let me know in the comment section about your thoughts and do follow and support this feed for more ideas. As a disclaimer before taking any positions consult your financial advisor.

PVR BREAKOUTPVR breakout good potential upside due to upcoming good movies like pathan etc and good collection in upcoming quater

Reliance long-term long viewthis is the updated view of my last post
long zone - 2210:2080
SL: 1850
as looking like its doing 1-2-3-4-5, let me know if anyone wants more info or has any doubts in idea, will be happy to answer all query :)

Make or break for Smallcap shares...My view is bearish as samllcap index is forming a rounding top pattern. Unless it negates the pattern, BUY ONLY selected strength stocks in momentum.

Midcaps looks stronger than smallcap.Look for opportunities in Midcap.
RSI Divergence played In midcap and is now sideways.
In Sideways market you can plan both Long and Short trades.

Bank Nifty: 41,600 the crucial Wall41600 has acted like quite like a Great Divide.
The stock had a major slump today. Given the technical indicators, it seem slike the downtrend would continue.

MARUTI - NSECompany website - www.marutisuzuki.com
49 % market share in Indian automotive market ( passenger ), slowly venturing into commercial also.
1800cr invested for future EV ready battery projects.
Roll out of EV charging infra by 2023 leading to mass acceptance.
Currently only 3 electric models in India across brands, charging times are high, avg range is less than 300km, not enough chargers on road, so still needs refining.
We have ICE engines for last 80 years, and still perfecting them , so EV have time, by 2025 expect disruption.
No debt, huge land bank, best service centre presence pan India.
When it comes to cars, a Maruti Suzuki never lets down ( Japanese tech )
Covid and semiconductor shortage hit auto markets worldwide, the share was muted. As economy reopens, things get back on track, share prices appreciates.
A must have in portfolio. BUY

