Nifty Still in Correction Hi
It look like, Nifty still is in correction.
We have completed A @ 17613 now we are in B & it may come upto 18225 after that will fall again for C & final leg of Wave 4.
Note: - In B, we have completed A & B Leg & now we expect C leg for 18225.
Best of Luck & Happy Diwali....!!!
Indianstocks

Coal India Hi
Coal India look attractive on current level & it should be in your portfolio on every dip for 2 months time....it will give good return.
Best of Luck....!!!

NMDC LONG Hi
NMDC looks good & attractive on current levels for 228.....this is portfolio stock & this require min 2 months time.
Best of Luck....!!!

Navin Fluorine Reversal TradeThe stock has reached lower trendline and may undergo a reversal rally. Trade is supported by brokerage calls and Supports Nearby.
Risk Reward Ratio - 3:1
SL is placed below support zone, 200 EMA, 200 MA & the lower trendline. The target is placed near resistance.

Asian Paints ReversalThe stock has reached lower trendline and may undergo a reversal rally. Trade is supported by brokerage calls and Supports Nearby.
Risk Reward Ratio - 3:1
SL is placed below support zone, 200 MA & the lower trendline. The target is placed near resistance.

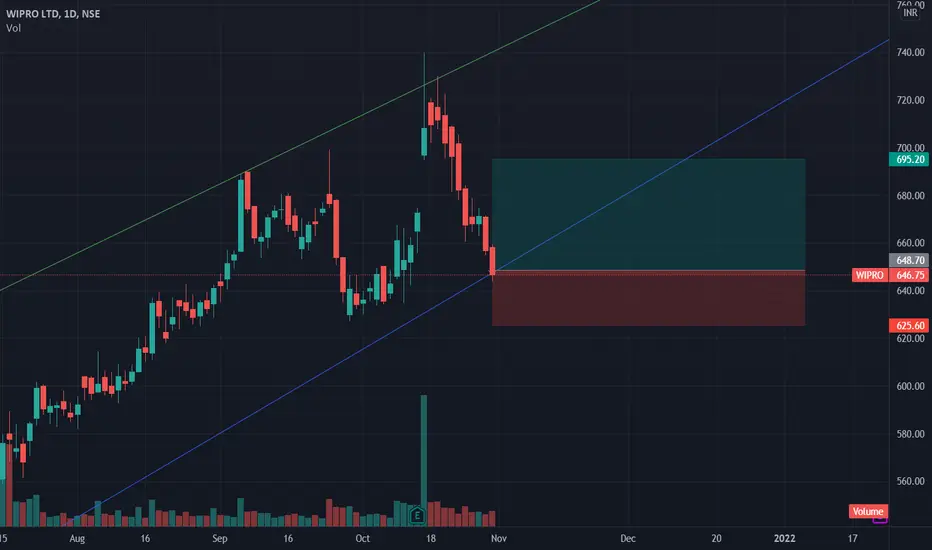
Wipro ReversalThe stock has reached lower trendline and may undergo a reversal rally. Trade is supported by brokerage calls and Supports Nearby.
Risk Reward Ratio - 2:1
SL is placed below support zone & the lower trendline. The target is placed near swing high.
Axis Bank BreakoutThe stock has broken out and retested, therefore may undergo a reversal rally. Trade is supported by brokerage calls and Supports Nearby.
Risk Reward Ratio - 3:1
SL is placed below support zone & the lower trendline. The target is placed based on fundamentals and near swing high.

ABB Price Movement or Trading Ideas ABB Stock Daily Price Movement Structure with Chart Keep eye on that it may be consolidate 23 days near given levels but when it will give breakout we can catch the good movement in intraday.

Long the IRCTC stock - Analysis for 27 Oct 2021Hello, This is my Technical Analysis for Indian Railway Catering and Tourism Corporation (IRCTC) stock.
According to my analysis the price will go up.
We should take a Buy entry at 4210
The target should be at 4390
Stop Loss at 4088
Note: This is just a Technical Analysis (it doesn't guarantee that the analysis will always be the correct) if by any chance we don't reach to our targeted price and you lose money then I will not be the liable person for your trade/investment on any particular asset that you have made, only you will be the responsible for your lose. Thank you for understanding.

Vinati Organics ReversalThe stock has reached lower trendline and may undergo a reversal rally. Trade is supported by brokerage calls and Supports Nearby.
Risk Reward Ratio - 2:1
SL is placed below support zone & the lower trendline. The target is placed near swing high.

TCS ReversalThe stock has reached lower trendline and may undergo a reversal rally. Trade is supported by brokerage calls and Supports Nearby.
Risk Reward Ratio - 3:1
SL is placed below support zone & the lower trendline. The target is placed near swing high.

TATA Communication ReversalThe stock has reached lower trendline and may undergo a reversal rally. Trade is supported by brokerage calls and Supports Nearby.
Risk Reward Ratio - 2:1
SL is placed below support zone & the lower trendline. The target is placed near swing high.

Sudarshan ChemicalThe stock has reached lower trendline and may undergo a reversal rally. Trade is supported by brokerage calls and Supports Nearby.
Risk Reward Ratio - 2:1
SL is placed below support zone & the lower trendline. The target is placed near swing high.

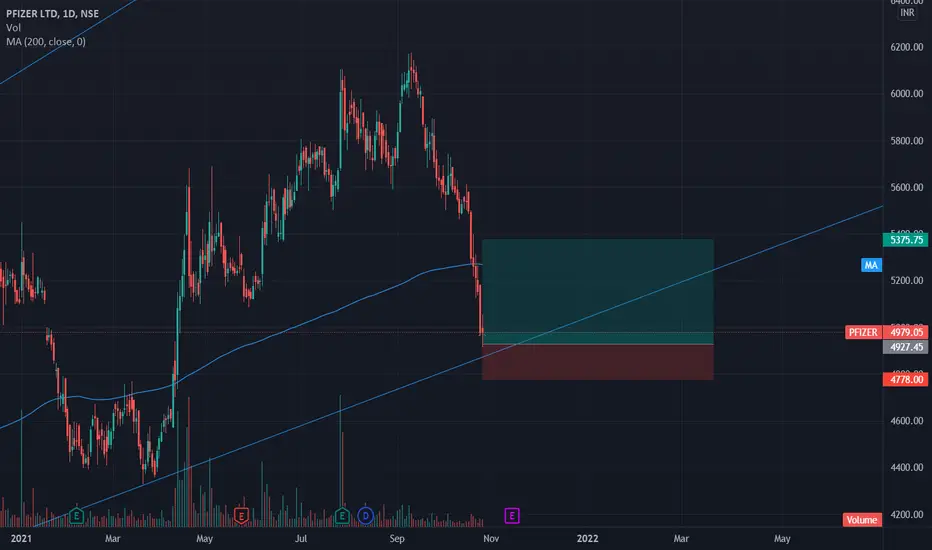
Pfizer ReversalThe stock has reached lower trendline and may undergo a reversal rally. Trade is supported by brokerage calls and Supports Nearby.
Risk Reward Ratio - 3:1
SL is placed below support zone & the lower trendline. The target is placed near swing high.
Godrej Agrovet ReversalThe stock has reached lower trendline and may undergo a reversal rally. Trade is supported by brokerage calls and Supports Nearby.
Risk Reward Ratio - 2:1
SL is placed below support zone & the lower trendline. The target is placed near swing high.

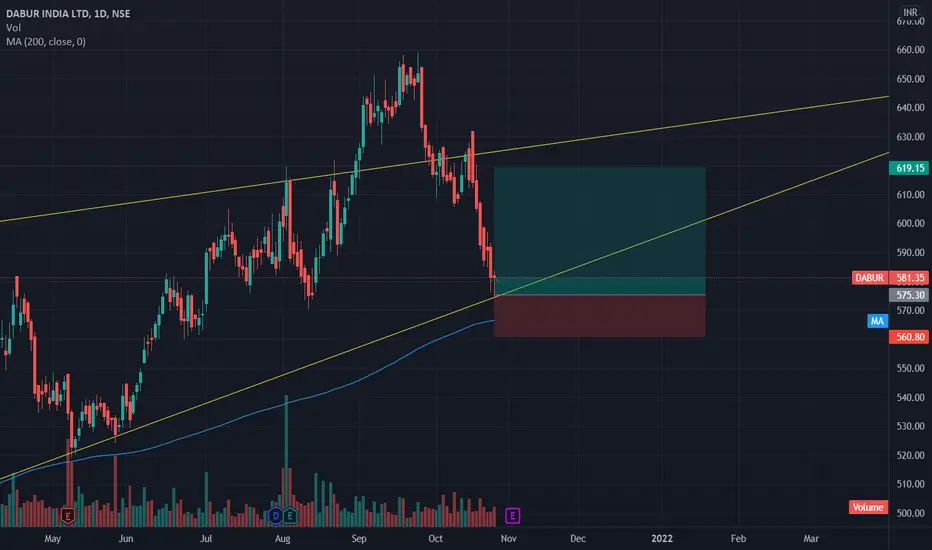
Dabur ReversalThe stock has reached lower trendline and may undergo a reversal rally. Trade is supported by brokerage calls and Supports Nearby.
Risk Reward Ratio - 3:1
SL is placed below support zone & the lower trendline. The target is placed near swing high.
Coromandel ReversalThe stock has reached lower trendline and may undergo a reversal rally. Trade is supported by brokerage calls and Supports Nearby.
Risk Reward Ratio - 2:1
SL is placed below support zone & the lower trendline. The target is placed near swing high.

TATA Consumer Products ReversalThe stock has reached lower trendline and may undergo a reversal rally. Trade is supported by brokerage calls and Supports Nearby.
Risk Reward Ratio - 2:1
SL is placed below support zone & the lower trendline. The target is placed near swing high.
This is a high risk trade as the market is in a overall bearish sentiment. Plan Trades Accordingly.

Siemens ReversalThe stock has reached lower trendline and may undergo a reversal rally. Trade is supported by brokerage calls and Supports Nearby.
Risk Reward Ratio - 2:1
SL is placed below support zone & the lower trendline. The target is placed near swing high.
This is a high risk trade as the market is in a overall bearish sentiment. Plan Trades Accordingly.

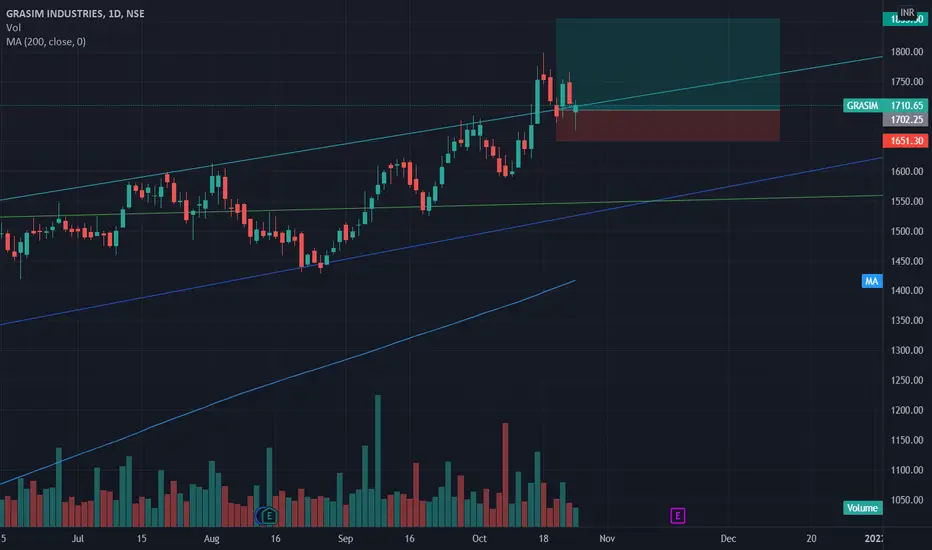
Grasim BreakoutThe stock has broken out and may undergo a rally. Trade is supported by brokerage calls and Supports Nearby.
Risk Reward Ratio - 3:1
SL is placed below support zone & the upper trendline. The target is placed near swing high.
This is a high risk trade as the market is in a overall bearish sentiment. Plan Trades Accordingly.
Britannia ReversalThe stock has reached lower trendline and may undergo a reversal rally. Trade is supported by brokerage calls and Supports Nearby.
Risk Reward Ratio - 3:1
SL is placed below support zone & the lower trendline. The target is placed near swing high.
This is a high risk trade as the market is in a overall bearish sentiment. Plan Trades Accordingly.

VST Industries ReversalThe stock has reached lower trendline and may undergo a reversal rally. Trade is supported by brokerage calls and Supports Nearby.
Risk Reward Ratio - 3:1
SL is placed below support zone & the lower trendline. The target is placed based on fundamentals and near swing high.

Bharat Forge ReversalThe stock has reached lower trendline and may undergo a reversal rally. Trade is supported by brokerage calls and Supports Nearby.
Risk Reward Ratio - 2:1
SL is placed below support zone & the lower trendline. The target is placed near swing high.
