Ashok Leyland BreakoutThe stock has broken out and retested, so it may undergo a rally. Trade is supported by brokerage calls and Supports Nearby.
Risk Reward Ratio - 2:1
SL is placed below support zone & the previously upper trendline. The target is placed based on fundamentals and near swing high.
Indianstocks

Greate opportunity in Tata steels.So here is the 1 day chart of Tata Steel ,as you all can see it creates a head and shoulders pattern and give a breakdown, now it is coming back for retest.
So in this case we have two opportunities
1- if it breakout the neckline and crosses it the next target would be 1470 which is its previous shoulder and if it even breakout shoulder the next Target is 1530 which is head.
2- the second possibility is that if it can't cross the neckline and reverse back than this is the sign of selling pressure and for this scenario we have target of 1250.
From my observation there are higher chances of downtrend,but we have to aware of both opportunities
🙏🏿
Thanks and regards
Ankit Mathela
Keep trading 🔥

SBI - breakout - longSBI has a breakout as shown on the charts. As suggested in the previous linked post, my bias was long SBI and this could be a good time to add to position.
If price comeback and closes back into the channel, we look to close short term trades. Positional investors can hold and look for further price changes

Berger Paints ReversalThe stock has reached lower trendline and may undergo a reversal rally. Trade is supported by brokerage calls and Supports Nearby.
Risk Reward Ratio - 2:1
SL is placed below support zone & the lower trendline. The target is placed near swing high.

MAX Financial ReversalThe stock has reached lower trendline and may undergo a reversal rally. Trade is supported by brokerage calls and Supports Nearby.
Risk Reward Ratio - 2:1
SL is placed below support zone & the lower trendline. The target is placed near swing high.

HDFC Asset Management an Ideal Swing Trade HDFC Asset Management an Ideal Swing Trade . A perfect support area for buying and a sure shot of 8-10% for a swing trade.

Heromotors - Long setupExtremely Bullish charts on both daily and weekly timeframes
HeroMotors is almost debt free with a good dividend yield of nearly 3%.
Good ROE and consistent track record for paying healthy dividends
From a technical standpoint, price is sitting on 200 Weekly Moving Average and right below the 200 Day Moving Average. Weekly MA will act as support and Daily may try and act like resistance zone
RSI is peaking up and bullish undertone on both daily and weekly charts. Look for a break above 3000 for a potential target near 3600 levels.
PLs do your own analysis before you take the trades

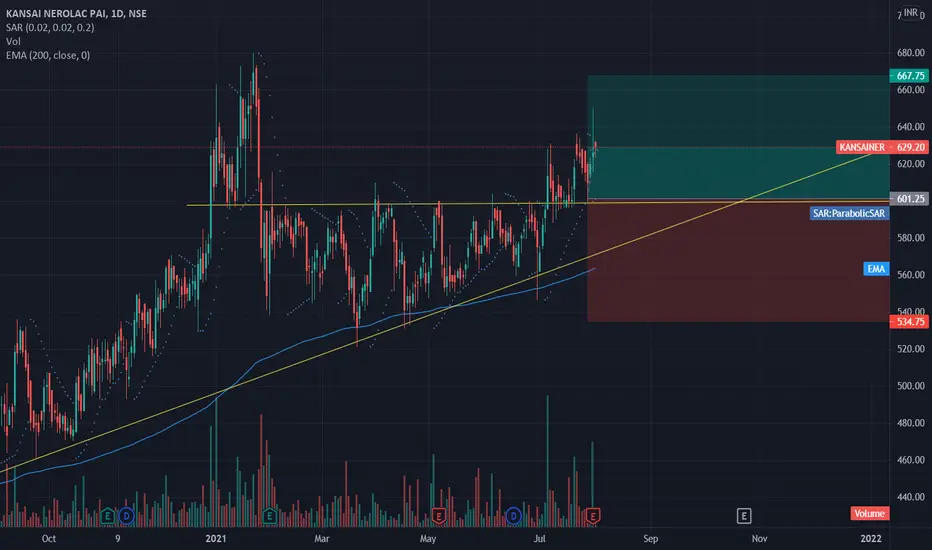
KansaiNerolac Short Term Breakout TradeThe stock has broken out and took a support at the previously upper trendline. Trade is supported by brokerage calls and Supports Nearby including 200 EMA .
The stock has previously broken out with good volumes and has retested the upper trendline which is the point of entry.
Risk Reward Ratio - 1:1.
SL is placed below multiple major support zone , 200 EMA and previously Lower Trendline and target is place near all time high.
Kansai Nerolac BreakoutThe stock has broken out and retested, so it may undergo a rally. Trade is supported by brokerage calls and Supports Nearby.
Risk Reward Ratio - 2:1
SL is placed below support zone & the previously upper trendline. The target is placed based on fundamentals and near swing high.

AIA Engineering ReversalThe stock has reached lower trendline and may undergo a reversal rally. Trade is supported by brokerage calls and Supports Nearby.
Risk Reward Ratio - 2:1
SL is placed below support zone & the lower trendline. The target is placed near swing high.

Ambuja Cements BreakoutThe stock has broken out and retested, so it may undergo a rally. Trade is supported by brokerage calls and Supports Nearby.
Risk Reward Ratio - 2:1
SL is placed below support zone & the previously upper and lower trendline. The target is placed based on fundamentals and near swing high.

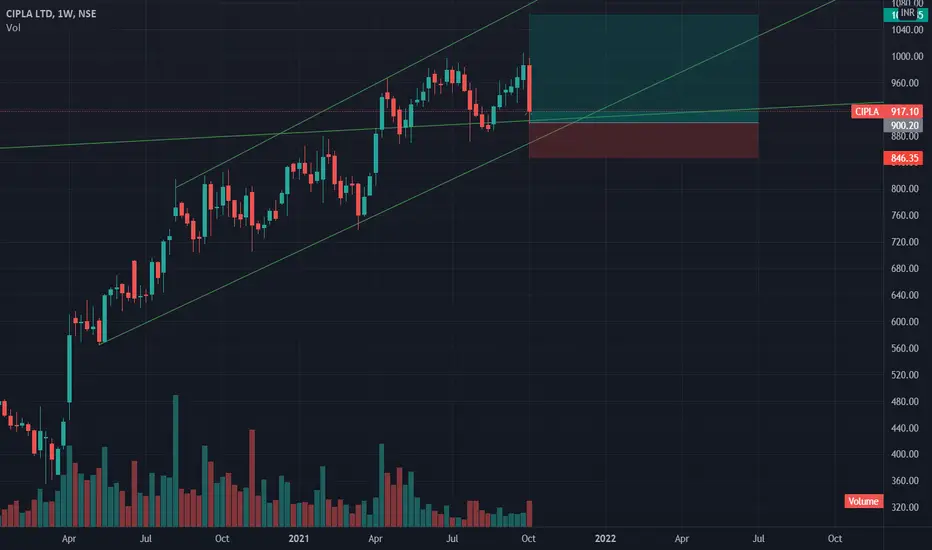
CIPLA Multi Year Range BreakoutThe stock has broken out with good volumes and retested, so it may undergo a rally. Trade is supported by brokerage calls and Supports Nearby.
Risk Reward Ratio - 3:1
SL is placed below support zone & the previously upper & lower trendline. The target is placed based on fundamentals.
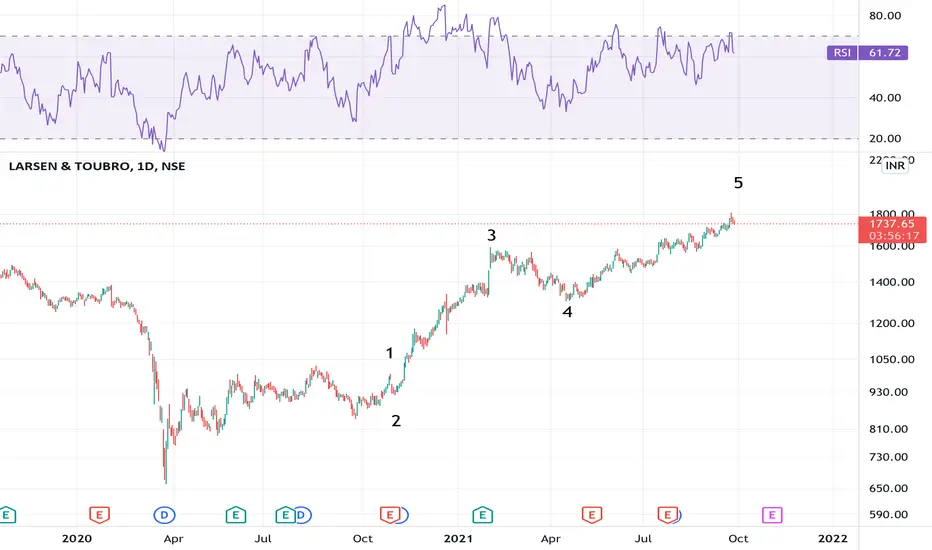
LT LT look like in Extended 3.5, we may see the retrace upto 1500 level from there will start upward move...!!!
TATAMotors ShortTerm Trade & Long+Mid Term Investing OpportunityStock broke down in the previous triangle pattern due to news regarding chip deficit and is nearing the strong support zone around 285 RS. It may find support and undergo a reversal rally within the current prize channel or breakdown causing further crash. Brokerage Houses around the world are bullish on the stock. Stock is good for traders to enter or for long term investors to enter as this price acts as a strong support zone preventing further downside with upward potential.
Enter The Stock after confirming support around RS 280-290.
Target Price - RS 338-355 (Near the Resistance for *Traders*) (*Investors* Can Hold on to the stock without exiting the trade for medium to long term investments)
Stop Loss - RS 260-250 supported by strong support and 200 EMA below (For *Traders*)
Risk Reward Ratio for Traders - 2:1
DYOR before taking action. No Trade can be 100% Successful. Position Sizing Is Important.
Also note for investors - This is not a Investment recommendation. It is just a good price level to add up stocks or newly invest into TATA Motors due to technical situation of the stock.

RK FORGE BREAKOUTA 3.5-year base breakout is seen in RK FORGE. It's also breaking out relative to the NIFTY SMALLCAP 100 Index.
I'm long from around the 900 levels for an initial target of 1345. Stop-loss can be a weekly closing under 680; making the risk-reward a little more than 1:2.
Not investment advice. This is only for educational and entertainment purposes. Please refer to your investment advisor before doing anything. I am neither a registered investment advisor nor a research analyst.

Coal India - Not yet there. Wait & Watch out! Its getting thereCoal India Ltd.
Not a lot to say, but for those who are stuck at top.. don't loose hope.. Time is coming.
Wether it will start a new and and its first Bullish structure or just a corrective one, that time will tell. However one thing is for sure. It will reverse and rebound for sure.

Siemens ReversalThe stock has reached lower trendline and may undergo a reversal rally. Trade is supported by brokerage calls and Supports Nearby.
Risk Reward Ratio - 2:1
SL is placed below support zone & the lower trendline. The target is placed near swing high.

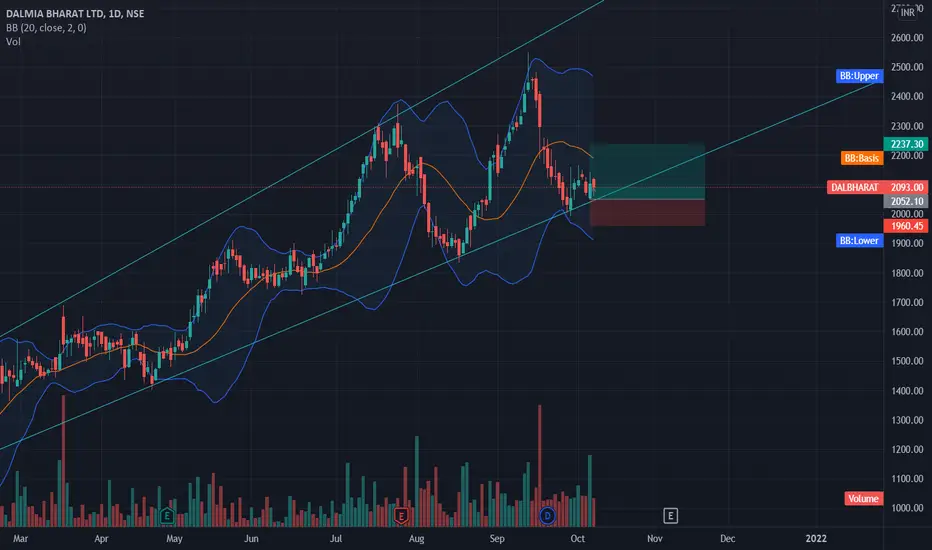
Dalmia Bharat ReversalThe stock has reached lower trendline and may undergo a reversal rally. Trade is supported by brokerage calls and Supports Nearby.
Risk Reward Ratio - 2:1
SL is placed below support zone & the lower trendline. The target is placed near swing high.
SUVENPHARMA - 2 BULLISH SIGNALS 1. Aroon crosover.
2. 5 * 21 EMA crossover.
Safe entry above 560, with SL as red line.

BANKNIFTY levels, RBI likely to Announce Repo Rate tomorrowWelcome to BANKNIFTY Futures and options
and optionchain data analysis for friday...
🛑 RBI will likely to announce Repo and interest Repo rates tomorrow morning at 10AM, due this major event volatility will likely toincreases,
◽ Right now every traders eye is on RBI
◽ Banknifty weekly pivot is at 37500
◽And monthly pivot is at 37300,
🛑 if we see day frame chart of BANKNIFTY currnetly trading above 21Day , 50 Day , 100 Day moving averages
🎯 Key levels to watch out for day trader
🛑 Major resistance zone for BankNifty is at 38050-38100 ( if see the option chain data on call 38000 CE strike holding more number for short position which will act as strong resistance area to bank Nifty )
◽ If market breakout resistance then we can see Target of 38300
◽ Whenever until breakout that resistance level don't trade
◽ Stop loss will be 37950
◽If gap down or slight gap up happens then 37900 will be resistance zone
🛑 Major support level for BankNifty
◽ Support level for nifty lies at 37550-37460
◽ Whenever until breakdown this level don't take a trade
◽ if Market successfully breakdown this level then we can take a trade
◽ And we can see the Target 1 will be 37300
◽STOP loss will be 37550
🛑 levels for banknifty futures will be also same
◽Go long on banknifty Futures if it breakout the resistance ie . 38050-38100
◽ Don't short the market until below the 37500
Don't take a trade if market open above or below our levels bcz market don't like gaps let the market to consolidate first and then take a trade
If you like it do follow for more
have a nice day 😊

BEML long if its close above 1380 then 4 month breakout with pattern, take trade only after candle close. for the target of 1550 in few weeks with strict sl of 1280.
good breakout that type of pattern generally gives target easily.

NIFTY levels n RBI will announce Repo rates by Tomorrow morning Welcome to NIFTY 50 Futures and options and option chain analysis for intraday trading ......................
🛑 RBI will likely to announce Repo and interest Repo rates due this volatility will likely increases, every traders eye is on RBI
◽Every trader eye is on RBI
◽ Weekly pivot point 17650
◽ Monthly pivot point 17450 ( Explained briefly Below I hope that you will like it do follow for more )
🛑 Nifty will be stronger above 18000 zone which crucial resistance zone if failed to close above that zone then we can see some correction in market it may can test the 17000 levels This will be crucial for nifty to sustain above the level until then market will be weaker , and fresh position buy only above 18000 until then stay light with quantity
🛑 Currently it is trading above 21Day ,50 Day, 100 Day moving averages
🎯 Key levels to watch out intraday levels for day trader
🛑 Major resistance zone for Nifty is at 17900-17950
◽ If market breakout resistance zone then we can see Target of 18050 as first target (if we see the Option chain data more short position are at 18000CE means from option chain data it acting as strong resistance)
◽ Stop loss for this level is 17850
🛑 Major support level for Nifty 50
◽ Support level for nifty lies at 17715-17670
◽ If breakdown happens we can see the 1st Target of 17570-17550
◽ stop loss ie .17770
🛑 levels for Nifty Futures will be as follows
◽ Go long on nifty Futures if it breakout our resistance 18000
◽ Don't short the market until below the 17660
◽In between range is indecisive
If you like it do follow for more
have a nice day 😊

BOSCH trading idea's ❗Bosch forming bullish Marubuzo candle stick pattern
◽ It indicating that there is so much buying interest in the stock that the market participants were willing to buy the stock at every point during the day ,
◽So much so, that the stock closed near it's high point for the day
◽It indicating this bullish sentiment will continue over the next few trading session's
◽We can see that it breakout descending triangle like pattern with huge volume
