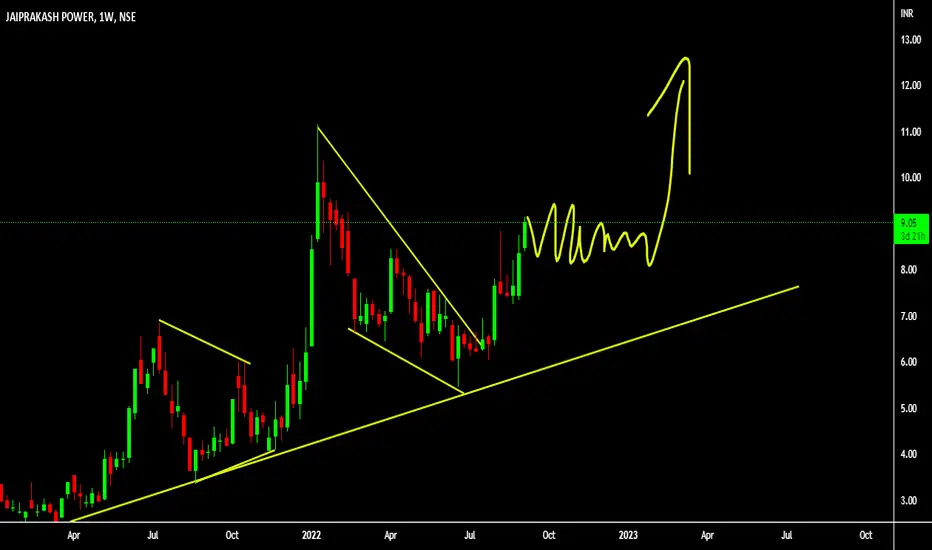
JPPOWER Wait for Bulls & Trend ReversalThe idea here is about Jai Prakash Power Ventures:
Jai prakash Power Ventures Ltd. engages in the generation of power. It operates through the following segments: Power and Transmission, Coal, and Other. The Power and Transmission segment includes generation, sale, and transmission of power. The Coal segment refers to the coal mining for captive use in energy generation. The Other segment consists of cement grinding.
My view is short term bearish & long term Bullish for the below observed technical factors.
Points as per TA on a Monthly, Weekly & daily Chart:
1. Contracting or symmetrical triangle formation observed with ABCD completed and expected move towards E on Elliott’s triangle pattern on a weekly chart as per below:
2. Cup & Handle formation observed on a Monthly chart & under ranging market at the time of publishing as per below:
3. Bearish Anti Butterfly Harmonic pattern completed swing target 2: A Swing = 6.45 which is also contracting or symmetrical triangle support zone as per below:
4. Bullish Gartley Harmonic Pattern CD leg in progress, min & max XD distance on Fib is 0.786 for Gartley which is 6.30. Which is also approx to contracting or symmetrical triangle support zone & Target 2 on Bearish Anti Butterfly Harmonic Pattern as per below:
5. Possible Inverse Head & Shoulder Pattern observed & price to be rejected @ 8.50 due to resistance zone & Bearish Anti Butterfly B point on a weekly chart as per below :
6. Elliott’s Bullish triangle ABCD points completed and Price direction towards E point on a weekly chart as per below:
7. Possible Head & Shoulder pattern observed on daily chart with support zone @ 6.75 as per below:
8. Trading way above 20 & 200 EMA on a weekly chart & 20 EMA cross over expected soon.
9. Trading above 200 EMA & 20 EMA Support on weekly chart.
10. Ichimoku Cloud analysis: Kumo Breakout & Kumo Twist on a daily & weekly is strong uptrend & monthly chart is consolidating at the time of publishing.
11. RSI is at 54.17 on a weekly Chart and 49.44 on daily chart at the time of publishing.
12. MACD above signal line on weekly & daily chart, However it is converging towards signal line on weekly chart.
13. Hull Moving average on daily is a sell and other moving averages on weekly & monthly chart is a strong buy.
14. ADX ( Average directional index ) trend strength is at 23.43 on a weekly & 11.70 on daily chart, which indicates a absent or weak trend ( ADX between 0-25 is a Absent or weak trend).
Projected Target with %: Wait for bulls to take over once the price hits 6.60 to 6.45 and enter long since the Risk to Reward looks damn good(Final % provided in chart), since the Earnings report which was on 22nd Oct 2022, looks good this week will give more clarity on Entry points,
Stop Loss: Entry only once we have confirmation for long.
Note: Any dip can be considered as accumulation.
Disclaimer: “The above is an Educational idea only and not any kind of financial or investment advice. So please do your own DD (Due Diligence) before any kind of investment”.
Do you like my TA & ideas!!
Want to keep yourself updated with current market action? Then don’t forget boost & to subscribe for more analysis.
Do leave your valuable feedback & comments for any improvisations.
Cheers.
Indiastocks

Ambika Cotton 👚 - Result pop and long way to go from here?NSE:AMBIKCO
I am sharing my view on Ambika cotton previously several times -
from Rs1200.00 - stock is now poised for strong upside of above Rs 2200
Results that has come for this share has been exceptional
In the video I am sharing the technical and fundamental -result for 31 / 12 /2021
Disc: Invested , do you due diligence and research before taking action.

Madras Fertilizers Traiangle breakout The idea here is about Madras Fertilizers:
Madras Fertilizers Ltd. engages in the manufacture and marketing of ammonia, urea, and complex fertilizers. It also produces bio-fertilizers and markets organic fertilizers and neem pesticides.
I am short term bullish on Madras Fertilizers due to below observed technical factors.
1. Contracting or Symmetrical triangle formation on a weekly chart as per below:
2. Possible bearish Butterfly pattern under formation as per below:
3. Trading above 200 EMA & Support established on 20 EMA on a weekly chart as per below:
4. Ichimoku Cloud analysis: Senkou Span B support established on a daily chart as per below:
5. Ichimoku Cloud analysis: Kumo Break out and kumo twist strong buy for upward momentum on daily & Weekly chart.
6. RSI is at 49.47 on a Daily Chart & 55.97 on a weekly chart at the time of publishing.
7. MACD below signal line on weekly chart & way converging towards signal line on daily chart.
8. Hull Moving average on daily & monthly chart is buy & sell on Weekly chart & other moving average is a strong buy on Weekly & monthly chart.
9. ADX (Average directional index) trend strength is at 24.93 on a weekly and 25.83 on a daily chart which indicates a strong trend ( ADX between 25 - 50 is a strong trend) in the current direction.
Projected targets as per bearish butterfly patterns provided in the chart.
Stop Loss: provided in chart as per contracting or symmetrical triangle.
Disclaimer: “The above is an Educational idea only and not any kind of financial or investment advice. So please do your own DD (Due Diligence) before any kind of investment”.
Do you like my TA & ideas!!
Want to keep yourself updated with current market action? Then don’t forget boost & to subscribe for more analysis.
Do leave your valuable feedback & comments for any improvisations.
Note : use the Load new Bars forward button to know the current movement.
Cheers.

JP POWER WEEKLY TIME FRAMEThe Structure looks good to us, waiting for this instrument to correct and then give us these opportunities as shown on this instrument (Price Chart).
Note: its my view only and its for educational purpose only. only who has got knowledge about this strategy, will understand what to be done on this setup. its purely based on my technical analysis only (strategies). we don't focus on the short term moves, we look for only for Bullish or Bearish Impulsive moves on the setups after a good price action is formed as per the strategy. we never get into corrective moves. because it will test our patience and also it will be a bullish or a bearish trap. and try trade the big moves.
we do not get into bullish or bearish traps. we anticipate and get into only big bullish or bearish moves (Impulsive moves).
Just ride the bullish or bearish impulsive move. Learn & Know the Complete Market Cycle.
buy low and sell high concept. buy at cheaper price and sell at expensive price.
Keep it simple, keep it Unique.
please keep your comments useful & respectful.
Thanks for your support....
#BANKNIFTY Can Rise From The FCP Zone Traders,
BANKNIFTY Can Rise Intraday. We have an FCP zone and an unfilled gap. So watch out for this intraday opportunity. NIFTY
Rules:
1. Never trade too much
2. Never trade without a confirmation
3. Never rely on signals, do your own analysis and research too
✅ If you found this idea useful, hit the like button, subscribe and share it in other trading forums.
✅ Follow me for future ideas, trade set ups and the updates of this analysis
✅ Don't hesitate to share your ideas, comments, opinions and questions.
Take care and trade well
-Vik
____________________________________________________
📌 DISCLAIMER
The content on this analysis is subject to change at any time without notice, and is provided for the sole purpose of education only.
Not a financial advice or signal. Please make your own independent investment decisions.
____________________________________________________

ADANI TOTAL GAS (BUY)A new trend has already started and we are buying on the RSI (above the 50 zone). Here we really have a high probability of winning.

UPL - Bull Flag Pattern Consolidation - Short Term BearishUPL had a great run of 260% from COVID lows to recent All Time Highs. Now the stock has taken a breather and consolidating in a bull flag . It looks like its gonna take some more time to consolidate in the channel before giving another breakout. I see the stock is bearish short term and might just test the lower end of the channel and bounce to the upper side of the channel. UPL might retest the support levels marked on the chart 674, 635 and 621. Strong support at 621 , long term buyers can start accumulating at small positions from 635 and 621 levels.

Karnataka Bank Big Breakout after 4 Years₹Karnataka Bank Chart:-
₹Karnataka Bank Broke out Big Resistance after 4 Years.
Resistance and Inverted H&S Pattern both Broke out.
Entry:- ₹73-₹77
Targets:- ₹112/₹153
Exit:- Below $70

BANKNIFTY Chart Analysis for Friday ❗Hii Traders 😊
Welcome to BANKNIFTY Futures and options analysis for friday
🛑 if we see day frame chart of BANKNIFTY currnetly trading above all moving averages ie . 21 Day , 50 Day , 100 Day
🛑 Banknifty may take support from 21Day moving average currnetly 21 Day moving average is at 37150 whenever until banknifty managed to trade above this level then market sentiment will be positive
🎯 Key levels to watch out for day trader
🛑 Major resistance zone for BankNifty is at 37900-37950
◽ If market breakout resistance then we can see Target of 38100
◽ Whenever until breakout that resistance level don't trade
◽ Stop loss will be 37800
◽ Whenever until banknifty didn't closed above 38150 then we can expect short term correction
🛑 Major support level for BankNifty
◽ Support level for nifty lies at 37300-37350
◽ Whenever until breakdown this level don't take a trade
◽ if Market successfully breakdown this level then we can take a trade
◽ And we can see the Target 1 will be 37000
◽Target 2 will be 36850
◽STOP loss will be 37450
◽Use Target 1 as trailing Stoploss to achieve 2nd target I sure you will not gone loose money for market
◽ Market will be indecisive between 37300-37950 (I also told this in yesterday's market analysis you check whether it's right or worng)
🛑 levels for banknifty futures will be also same
◽Go long on banknifty Futures if it breakout the resistance
◽ Don't short the market until below the 37300
◽More shorter's were active when Banknifty traded below 37300-37250 zone
🛑 TRADESHOTS
◽ Resistance level for CE buyers /option buyers is at 37900-37950
◽ support zone to buy PUT / PE is at 37300-37350
◽ BankNifty will be weaker on intraday basis below the 37600
Thanks for reading 😊
I hope that it will help a lot and if I'm wrong kindly comment mine mistake surely I will correct it
If you like it do follow for more and give reputation which will boost mine confidence to do more.
have a nice day 😊

FORTIS HLTH INDIAHLO
THIS IS A ANALYSIS OF FORTIS
1. breakout of channels
2. with supports of 200 ema on 1hourly chart and 15 min
3. fib extentions levels (grey lines ) or use fib levels or pivot points
thanks

A SWING TRADE IN BATA INDIANSE:BATAINDIA
BATA INDIA GIVING A BREAK OUT OF RESISTANCE POINT AND NOW MOVING UP FOR TARGET OF 1700++
ONE CAN DEFINETLY BUY THIS FOR AMAZING RETURN IN SHORT TERM

Bata IndiaBuy Bata India CMP 1632 buy range 1579-1600 stop loss 1300 Target 2550
( add if it comes back in triangle if there huge correction) Short term SL 1527

IOLCP/INR Bullish Breakout TA Update#IOLCP/INR ( India Stock )
₹IOLCP currently broke out resistance.
And I am expecting minimum 50% from here.
If I follow chart then Target will be 100% from here.
But 50% is safe side.
Entry:- below ₹680 is good entry.
Targets:- ₹788/₹895/₹1078/₹1310
Stop Loss:- ₹599
Please click like button and Appreciate my hard work.
Must follow me for latest crypto real time updates.
Thank you.

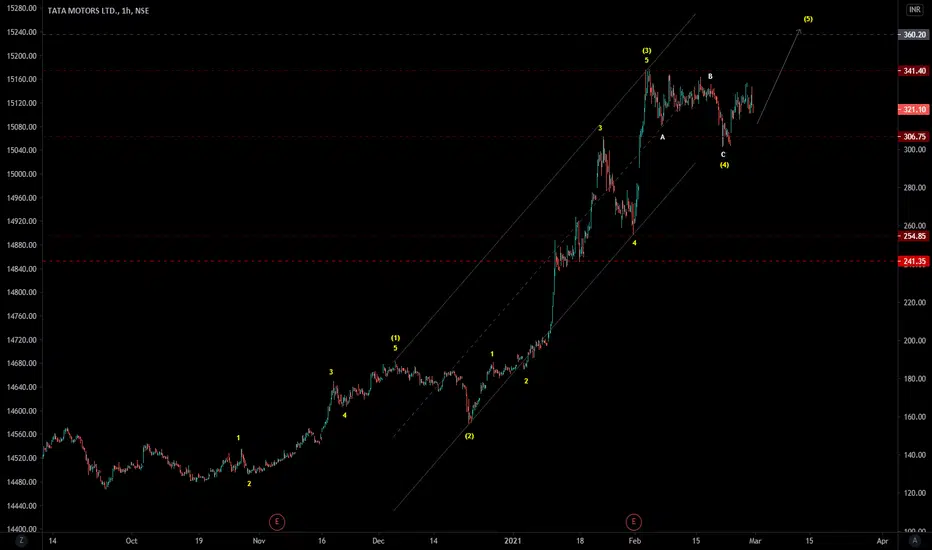
Tatamotors - Elliott wave analysis -5th wave up it is in impulsive up trend and 5th wave progressing. The target will be around 350-360 zone.
Plz give a like if you agree with EW count.
Coalindia - Elliott wave analysis - C wave upIt is in C wave up in ABC zigzag cycle. The 5th wave up of C will start soon. It is either completing C wave or 1st wave of C wave. We will know when it start correcting the move.

HDFCBANK - Elliott wave analysis - sideways correctionIt is within correction mode and expected to go higher in complex sideways correction to finish the X wave cycle. The Y will only start moving down after X wave finished. Both Buy first and Short sell later when completed X wave will be the possible trade set up.

Short the Nifty 50 for a double bottom back to 7600 by sept1. There's a clear bearish wedge that's formed in the past 3 months bear market rally.
2. The 10000-10500 zone is strong resistance
3. 61% fibonacci retracement is also going to provide resistance as bear market rallies shouldn't really violate this level
4. FIIs (foreign institutional investors) have been continuously selling into strength which does make for a very weak case for continued bullish moves
5. I am also bearish on the american markets, which could alone be a strong enough reason, above and beyond the aforementioned points.

Adani Port & Special Economic Zone (Adaniport - NSE) - impulseAdani Port & Special Economic Zone Ltd (Adaniport - NSE) is moving up in 5th internal wave of subwave 3rd of 3rd wave as indicated in chart. As mentioned in previous updates it is going up in impulse and unless it retains above invalidation level, it is good buying candidate. In weekly time frame it is in 5th wave up.

TATA Motors Trade Update | 5% updaily close of 27 may is above trend line.
sorry unable to update here for some reason.
Selling Volume also looks really big so will take 50% profit at 5% and with stop at entry and hold for another run

