Bullish momentum to extend?DAX40 (DE40) has bounced off the pivot and could potentially rise to the 1st resistance.
Pivot: 23,438.30
1st Support: 22,533.30
1st Resistance: 24,741.85
Risk Warning:
Trading Forex and CFDs carries a high level of risk to your capital and you should only trade with money you can afford to lose. Trading Forex and CFDs may not be suitable for all investors, so please ensure that you fully understand the risks involved and seek independent advice if necessary.
Disclaimer:
The above opinions given constitute general market commentary, and do not constitute the opinion or advice of IC Markets or any form of personal or investment advice.
Any opinions, news, research, analyses, prices, other information, or links to third-party sites contained on this website are provided on an "as-is" basis, are intended only to be informative, is not an advice nor a recommendation, nor research, or a record of our trading prices, or an offer of, or solicitation for a transaction in any financial instrument and thus should not be treated as such. The information provided does not involve any specific investment objectives, financial situation and needs of any specific person who may receive it. Please be aware, that past performance is not a reliable indicator of future performance and/or results. Past Performance or Forward-looking scenarios based upon the reasonable beliefs of the third-party provider are not a guarantee of future performance. Actual results may differ materially from those anticipated in forward-looking or past performance statements. IC Markets makes no representation or warranty and assumes no liability as to the accuracy or completeness of the information provided, nor any loss arising from any investment based on a recommendation, forecast or any information supplied by any third-party.
Indices

Bullish momentum to extend?GER40 has bounced off the support level which is a pullback support and could potentially rise from this level to our take profit.
Entry: 23,511.62
Why we like it:
There is a pullback support level.
Stop loss: 23,150.34
Why we like it:
There is a pullback support level.
Take profit: 24,780.49
Why we like it:
There is a resistance level at the 127.2% Fibonacci extension.
Enjoying your TradingView experience? Review us!
Please be advised that the information presented on TradingView is provided to Vantage (‘Vantage Global Limited’, ‘we’) by a third-party provider (‘Everest Fortune Group’). Please be reminded that you are solely responsible for the trading decisions on your account. There is a very high degree of risk involved in trading. Any information and/or content is intended entirely for research, educational and informational purposes only and does not constitute investment or consultation advice or investment strategy. The information is not tailored to the investment needs of any specific person and therefore does not involve a consideration of any of the investment objectives, financial situation or needs of any viewer that may receive it. Kindly also note that past performance is not a reliable indicator of future results. Actual results may differ materially from those anticipated in forward-looking or past performance statements. We assume no liability as to the accuracy or completeness of any of the information and/or content provided herein and the Company cannot be held responsible for any omission, mistake nor for any loss or damage including without limitation to any loss of profit which may arise from reliance on any information supplied by Everest Fortune Group.

NASDAQ Potential Bullish Reversal OpportunityNASDAQ price action went through a massive correction during the global tariff war.
However after potential recent developments, we may finally see a direction towards the resolution of widespread tariff based uncertainty across the macro economic landscape.
This presents us with a potential Reversal opportunity if we see the formation of a credible Higher High (given a potential proper break out) on the Daily and shorter timeframes.
Trade Plan :
Entry @ 20440
Stop Loss @ 19500
TP 1 @ 21380

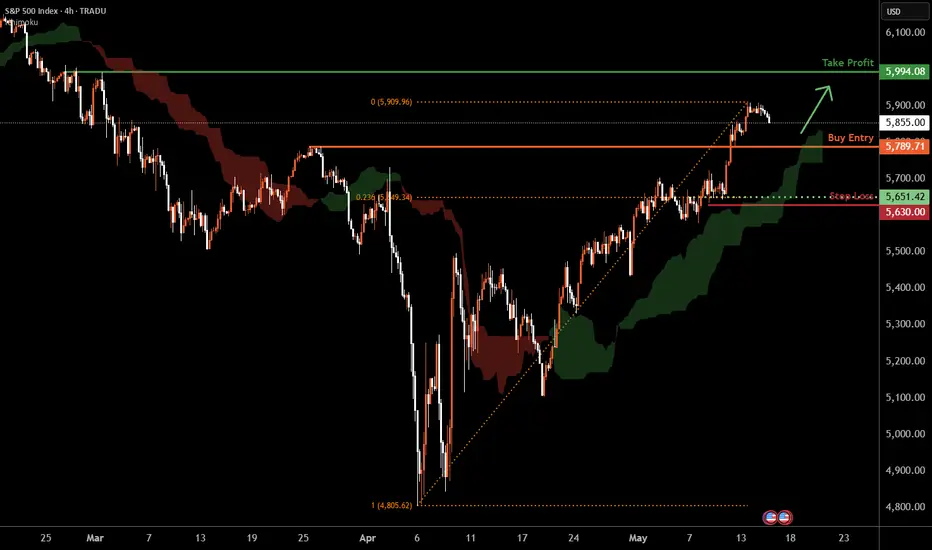
SPX500 H4 | Potential bullish bounceSPX500 is falling towards a pullback support and could potentially bounce off this level to climb higher.
Buy entry is at 5,789.71 which is a pullback support.
Stop loss is at 5,630.00 which is a level that lies underneath an overlap support and the 23.6% Fibonacci retracement.
Take profit is at 5,994.08 which is a multi-swing-high resistance.
High Risk Investment Warning
Trading Forex/CFDs on margin carries a high level of risk and may not be suitable for all investors. Leverage can work against you.
Stratos Markets Limited (tradu.com):
CFDs are complex instruments and come with a high risk of losing money rapidly due to leverage. 63% of retail investor accounts lose money when trading CFDs with this provider. You should consider whether you understand how CFDs work and whether you can afford to take the high risk of losing your money.
Stratos Europe Ltd (tradu.com):
CFDs are complex instruments and come with a high risk of losing money rapidly due to leverage. 63% of retail investor accounts lose money when trading CFDs with this provider. You should consider whether you understand how CFDs work and whether you can afford to take the high risk of losing your money.
Stratos Global LLC (tradu.com):
Losses can exceed deposits.
Please be advised that the information presented on TradingView is provided to Tradu (‘Company’, ‘we’) by a third-party provider (‘TFA Global Pte Ltd’). Please be reminded that you are solely responsible for the trading decisions on your account. There is a very high degree of risk involved in trading. Any information and/or content is intended entirely for research, educational and informational purposes only and does not constitute investment or consultation advice or investment strategy. The information is not tailored to the investment needs of any specific person and therefore does not involve a consideration of any of the investment objectives, financial situation or needs of any viewer that may receive it. Kindly also note that past performance is not a reliable indicator of future results. Actual results may differ materially from those anticipated in forward-looking or past performance statements. We assume no liability as to the accuracy or completeness of any of the information and/or content provided herein and the Company cannot be held responsible for any omission, mistake nor for any loss or damage including without limitation to any loss of profit which may arise from reliance on any information supplied by TFA Global Pte Ltd.
The speaker(s) is neither an employee, agent nor representative of Tradu and is therefore acting independently. The opinions given are their own, constitute general market commentary, and do not constitute the opinion or advice of Tradu or any form of personal or investment advice. Tradu neither endorses nor guarantees offerings of third-party speakers, nor is Tradu responsible for the content, veracity or opinions of third-party speakers, presenters or participants.
Bullish continuation?Dow Jones (US30) is falling towards the pivot and could bounce to the 1st resistance, which is a pullback resistance that lines up with the 161.8% Fibonacci extension.
Pivot: 41,309.98
1st Support: 40,778.41
1st Resistance: 42,730.89
Risk Warning:
Trading Forex and CFDs carries a high level of risk to your capital and you should only trade with money you can afford to lose. Trading Forex and CFDs may not be suitable for all investors, so please ensure that you fully understand the risks involved and seek independent advice if necessary.
Disclaimer:
The above opinions given constitute general market commentary, and do not constitute the opinion or advice of IC Markets or any form of personal or investment advice.
Any opinions, news, research, analyses, prices, other information, or links to third-party sites contained on this website are provided on an "as-is" basis, are intended only to be informative, is not an advice nor a recommendation, nor research, or a record of our trading prices, or an offer of, or solicitation for a transaction in any financial instrument and thus should not be treated as such. The information provided does not involve any specific investment objectives, financial situation and needs of any specific person who may receive it. Please be aware, that past performance is not a reliable indicator of future performance and/or results. Past Performance or Forward-looking scenarios based upon the reasonable beliefs of the third-party provider are not a guarantee of future performance. Actual results may differ materially from those anticipated in forward-looking or past performance statements. IC Markets makes no representation or warranty and assumes no liability as to the accuracy or completeness of the information provided, nor any loss arising from any investment based on a recommendation, forecast or any information supplied by any third-party.

Tariffs Shocked the World, But Look What Happened NextTrump's “Liberation Day” reciprocal tariff announcement triggered a sharp selloff in the S&P 500 on the 2nd April. A classic policy shock! But the market has since clawed back every point.
So what now? Let’s break it down by strategy.
🔎 Long-Term Investors: Stay the Course
1) This recovery reinforces one truth: When you own quality businesses, Volatility ≠ Risk. Policy creates opportunity, not exit signals.
2) Stick with great companies, buy on fear, and ignore the noise. The next 10 years won’t be won by panic.
⚡ Momentum Traders: Technical Reversal Delivered
1) S&P 500 bounced above its 30-day MA. With the May 12th’s bullish gap (post temporary tariff pause) confirming the trend shift.
2) This was a textbook momentum setup. But if you didn’t plan for the whipsaw, you missed the edge.
📈 What This Means Now
Short-term volatility is likely to continue as tariffs, rates, and elections are all on the table.
Watch for pullbacks into structure and keep risk tight as news-driven moves will be fast and brutal.
Choose your timeframe. Respect the trend. Don’t confuse noise with signal.
The edge now isn’t in prediction — it’s in preparation.

US10 YR Yield Weekly Chart Analysis: NFAUS10 YR Yield Weekly Chart Analysis: NFA
-After sweeping the previous swing high we retraced back to 50% Fib(Equilibrium)
-Expecting this Week's candle wick to sweep Sellside Liquidity-1 and bounce
-If we bounce from here, iFVG-W (red rectangle) will be our resistance zone
-Rejection from that level can send it back to sellside and our next target will be BISI-W(green rectangle)
If any of these Support/Resistance levels are invalidated i will update the idea next week.
**Major economic events can cause drastic moves and invalidate these levels**

S&P500: VIX confirmed new Bull Cycle, eyes 9,800.S&P500 is on excellent bullish levels on its 1D technical outlook (RSI = 66.480, MACD = 76.110, ADX = 38.627) and has technically fulfilled all conditions to extend this recovery and transition into a new Bull Cycle. VIX shows with its massive spike and then aggressive retreat that the correction's bottom is in and is in fact similar to March 2020 (COVID) and March 2009 (subprime crisis). The Bull Cycles after those were similar, the smallest was +105.62%. In accordance to that, we have a long term TP = 9,800.
## If you like our free content follow our profile to get more daily ideas. ##
## Comments and likes are greatly appreciated. ##

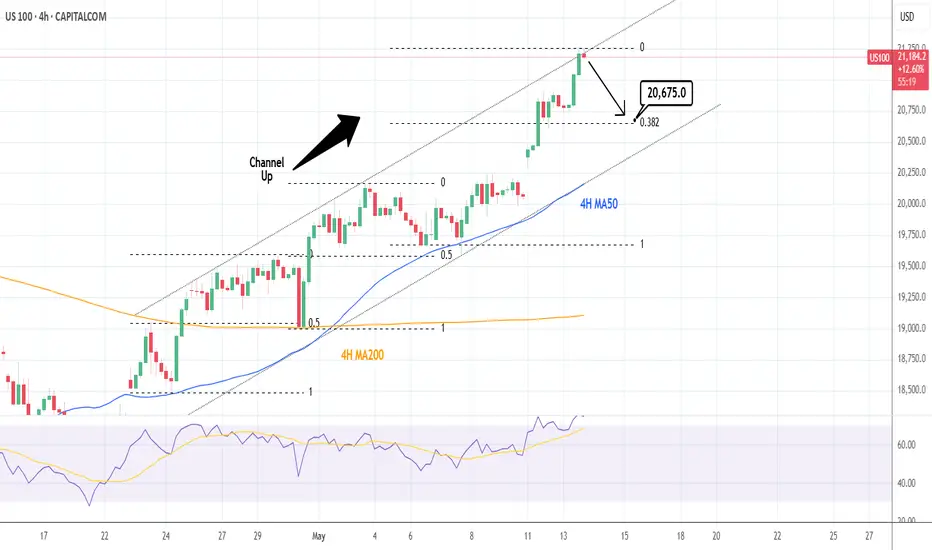
NASDAQ: Time for a 4H technical correction.Nasdaq is almost overbought on its 1D technical outlook (RSI = 69.775, MACD = 371.830, ADX = 37.524) and has reached the top of its 4H Channel Up. The two HH that the pattern has both pulled back to the 0.5 Fibonacci retracement level before the 4H MA50 provided the necessary support for the next bullish wave. Consequently we expect a small correction to at least the 0.382 Fib next (TP = 20,675).
See how our prior idea has worked out:
## If you like our free content follow our profile to get more daily ideas. ##
## Comments and likes are greatly appreciated. ##
DAX H4 | Bullish uptrend to extend higher?The DAX (GER30) is trading close to an overlap support and could potentially bounce off this level to climb higher.
Buy entry is at 23,447.57 which is an overlap support.
Stop loss is at 22,700.00 which is a level that lies underneath an overlap support and the 23.6% Fibonacci retracement.
Take profit is at 24,732.86 which is a resistance that aligns with the 127.2% Fibonacci extension.
High Risk Investment Warning
Trading Forex/CFDs on margin carries a high level of risk and may not be suitable for all investors. Leverage can work against you.
Stratos Markets Limited (tradu.com):
CFDs are complex instruments and come with a high risk of losing money rapidly due to leverage. 63% of retail investor accounts lose money when trading CFDs with this provider. You should consider whether you understand how CFDs work and whether you can afford to take the high risk of losing your money.
Stratos Europe Ltd (tradu.com):
CFDs are complex instruments and come with a high risk of losing money rapidly due to leverage. 63% of retail investor accounts lose money when trading CFDs with this provider. You should consider whether you understand how CFDs work and whether you can afford to take the high risk of losing your money.
Stratos Global LLC (tradu.com):
Losses can exceed deposits.
Please be advised that the information presented on TradingView is provided to Tradu (‘Company’, ‘we’) by a third-party provider (‘TFA Global Pte Ltd’). Please be reminded that you are solely responsible for the trading decisions on your account. There is a very high degree of risk involved in trading. Any information and/or content is intended entirely for research, educational and informational purposes only and does not constitute investment or consultation advice or investment strategy. The information is not tailored to the investment needs of any specific person and therefore does not involve a consideration of any of the investment objectives, financial situation or needs of any viewer that may receive it. Kindly also note that past performance is not a reliable indicator of future results. Actual results may differ materially from those anticipated in forward-looking or past performance statements. We assume no liability as to the accuracy or completeness of any of the information and/or content provided herein and the Company cannot be held responsible for any omission, mistake nor for any loss or damage including without limitation to any loss of profit which may arise from reliance on any information supplied by TFA Global Pte Ltd.
The speaker(s) is neither an employee, agent nor representative of Tradu and is therefore acting independently. The opinions given are their own, constitute general market commentary, and do not constitute the opinion or advice of Tradu or any form of personal or investment advice. Tradu neither endorses nor guarantees offerings of third-party speakers, nor is Tradu responsible for the content, veracity or opinions of third-party speakers, presenters or participants.

Nasdaq-100 H4 | Falling toward a pullback supportThe Nasdaq-100 (NAS100) is falling towards a pullback support and could potentially bounce off this level to climb higher.
Buy entry is at 20,336.30 which is a pullback support.
Stop loss is at 19,500.00 which is a level that lies underneath an overlap support and the 23.6% Fibonacci retracement.
Take profit is at 21,500.25 which is a pulback resistance that aligns with the 127.2% Fibonacci extension.
High Risk Investment Warning
Trading Forex/CFDs on margin carries a high level of risk and may not be suitable for all investors. Leverage can work against you.
Stratos Markets Limited (tradu.com):
CFDs are complex instruments and come with a high risk of losing money rapidly due to leverage. 63% of retail investor accounts lose money when trading CFDs with this provider. You should consider whether you understand how CFDs work and whether you can afford to take the high risk of losing your money.
Stratos Europe Ltd (tradu.com):
CFDs are complex instruments and come with a high risk of losing money rapidly due to leverage. 63% of retail investor accounts lose money when trading CFDs with this provider. You should consider whether you understand how CFDs work and whether you can afford to take the high risk of losing your money.
Stratos Global LLC (tradu.com):
Losses can exceed deposits.
Please be advised that the information presented on TradingView is provided to Tradu (‘Company’, ‘we’) by a third-party provider (‘TFA Global Pte Ltd’). Please be reminded that you are solely responsible for the trading decisions on your account. There is a very high degree of risk involved in trading. Any information and/or content is intended entirely for research, educational and informational purposes only and does not constitute investment or consultation advice or investment strategy. The information is not tailored to the investment needs of any specific person and therefore does not involve a consideration of any of the investment objectives, financial situation or needs of any viewer that may receive it. Kindly also note that past performance is not a reliable indicator of future results. Actual results may differ materially from those anticipated in forward-looking or past performance statements. We assume no liability as to the accuracy or completeness of any of the information and/or content provided herein and the Company cannot be held responsible for any omission, mistake nor for any loss or damage including without limitation to any loss of profit which may arise from reliance on any information supplied by TFA Global Pte Ltd.
The speaker(s) is neither an employee, agent nor representative of Tradu and is therefore acting independently. The opinions given are their own, constitute general market commentary, and do not constitute the opinion or advice of Tradu or any form of personal or investment advice. Tradu neither endorses nor guarantees offerings of third-party speakers, nor is Tradu responsible for the content, veracity or opinions of third-party speakers, presenters or participants.

Potential bearish drop?Dow Jones (US30) is reacting off the pivot and could drop to the 1st support that aligns with the 61.8% Fibonacci retracement.
Pivot: 42,479.50
1st Support: 41,294.20
1st Resistance: 43,190.10
Risk Warning:
Trading Forex and CFDs carries a high level of risk to your capital and you should only trade with money you can afford to lose. Trading Forex and CFDs may not be suitable for all investors, so please ensure that you fully understand the risks involved and seek independent advice if necessary.
Disclaimer:
The above opinions given constitute general market commentary, and do not constitute the opinion or advice of IC Markets or any form of personal or investment advice.
Any opinions, news, research, analyses, prices, other information, or links to third-party sites contained on this website are provided on an "as-is" basis, are intended only to be informative, is not an advice nor a recommendation, nor research, or a record of our trading prices, or an offer of, or solicitation for a transaction in any financial instrument and thus should not be treated as such. The information provided does not involve any specific investment objectives, financial situation and needs of any specific person who may receive it. Please be aware, that past performance is not a reliable indicator of future performance and/or results. Past Performance or Forward-looking scenarios based upon the reasonable beliefs of the third-party provider are not a guarantee of future performance. Actual results may differ materially from those anticipated in forward-looking or past performance statements. IC Markets makes no representation or warranty and assumes no liability as to the accuracy or completeness of the information provided, nor any loss arising from any investment based on a recommendation, forecast or any information supplied by any third-party.

DOW JONES: Breached the 1D MA200. Tariff War 2018 Recovery aheadDow Jones is on excellent bullish levels on its 1D technical outlook (RSI = 62.103, MACD = 203.720, ADX = 34.693) and as it crossed today above the 1D MA200 for the first time since April 2nd, and practically validates the recovery from the Tariff War correction, it draws strong comparisons with the last U.S.-China Tariff War in 2018. Both rebounded after highly oversold 1D RSI levels, and the 2019 recovery almost hit the 0.9 Fibonacci level before turning into a less aggressive recovery. The trade is long, TP = 44,100.
## If you like our free content follow our profile to get more daily ideas. ##
## Comments and likes are greatly appreciated. ##

US DOLLAR Analysis: Bullish Momentum Building?TVC:DXY is finally showing signs of stabilization. The index has successfully rejected a key support level, an area where price has historically attracted strong buying interest. This level closely aligns with the psychological $100 mark, which has once again acted as a pivotal point for market participants, reinforcing its relevance as a key technical level.
The recent price action confirms bullish interest, as evidenced by a strong rejection pattern within the zone, with long lower wicks and bullish follow-through candles. The support zone held firm, and buyers have stepped in, initiating an upward move.
Now that price has bounced from this level, the probability of a continued rally increases. If the bullish momentum sustains, the price could move toward the 102.500 level, a logical near-term target based on previous structure and minor resistance.
However, a failure to maintain above the 100.00 handle or a sudden shift in sentiment could still pose downside risks. A confirmed breakdown below the green support zone would invalidate this bullish outlook and potentially open the door for further declines.
Remember, always confirm your setups and use proper risk management.

US100 - Correction Required Before Next Major Rally PhaseThe US Tech 100 index is showing signs of exhaustion after a strong recovery rally from April lows, with price action now facing resistance at the upper blue box around 20,200. The index appears to be forming a short-term top as momentum wanes, evidenced by recent candle patterns displaying indecision and inability to sustain new highs. The downward-pointing red arrow suggests a likely move toward the middle support zone around 19,000, which would represent a healthy correction of about 5-6% from current levels. This pullback would help reset overbought technical indicators and potentially shake out weak hands before establishing a stronger foundation for the next leg higher. Given the sharp rally we've witnessed from the April lows near 16,400, this correction would be technically justified and provide a more sustainable launching pad for continuation of the longer-term uptrend once complete.
Disclosure: I am part of Trade Nation's Influencer program and receive a monthly fee for using their TradingView charts in my analysis.

NQ Analysis - 11th May 2025Here is my analysis of NQ, a pair I do not trade and only very seldomly do analysis for.
I've been wanting to get into indices futures, so I will be doing more analysis on them in the future. I still have to learn about the contract sizes, average moves, etc.
- R2F Trading

S&P 500 Daily Chart Analysis For Week of May 9, 2025Technical Analysis and Outlook:
In the initial days of this week’s trading session, the S&P 500 Index exhibited a steady to low price movement pattern, successfully achieving a significant target at the Mean Support level of 5601, as indicated in last week’s Daily Chart Analysis. Subsequently, the Index experienced a robust rebound, effectively retesting the Mean Resistance level of 5692. This upward trajectory achievement established a reversal pattern for the downward acceleration to repeat the Mean Support level 5601 retest. However, it is critical to recognize the considerable risk of a sharp upward movement from the current price action, which may lead to an ascent toward the next Mean Support level of 5778. Furthermore, there exists the potential for additional escalation, potentially reaching the Outer Index Rally level of 5915 and beyond.

FTSE 100 H4 | Potential bullish bounceThe FTSE 100 (UK100) is falling towards an overlap support and could potentially bounce off this level to climb higher.
Buy entry is at 8,474.09 which is an overlap support that aligns close to the 23.6% Fibonacci retracement.
Stop loss is at 8,150.00 which is a level that lies underneath an overlap support.
Take profit is at 8,744.02 which is a multi-swing-high resistance.
High Risk Investment Warning
Trading Forex/CFDs on margin carries a high level of risk and may not be suitable for all investors. Leverage can work against you.
Stratos Markets Limited (tradu.com):
CFDs are complex instruments and come with a high risk of losing money rapidly due to leverage. 63% of retail investor accounts lose money when trading CFDs with this provider. You should consider whether you understand how CFDs work and whether you can afford to take the high risk of losing your money.
Stratos Europe Ltd (tradu.com):
CFDs are complex instruments and come with a high risk of losing money rapidly due to leverage. 63% of retail investor accounts lose money when trading CFDs with this provider. You should consider whether you understand how CFDs work and whether you can afford to take the high risk of losing your money.
Stratos Global LLC (tradu.com):
Losses can exceed deposits.
Please be advised that the information presented on TradingView is provided to Tradu (‘Company’, ‘we’) by a third-party provider (‘TFA Global Pte Ltd’). Please be reminded that you are solely responsible for the trading decisions on your account. There is a very high degree of risk involved in trading. Any information and/or content is intended entirely for research, educational and informational purposes only and does not constitute investment or consultation advice or investment strategy. The information is not tailored to the investment needs of any specific person and therefore does not involve a consideration of any of the investment objectives, financial situation or needs of any viewer that may receive it. Kindly also note that past performance is not a reliable indicator of future results. Actual results may differ materially from those anticipated in forward-looking or past performance statements. We assume no liability as to the accuracy or completeness of any of the information and/or content provided herein and the Company cannot be held responsible for any omission, mistake nor for any loss or damage including without limitation to any loss of profit which may arise from reliance on any information supplied by TFA Global Pte Ltd.
The speaker(s) is neither an employee, agent nor representative of Tradu and is therefore acting independently. The opinions given are their own, constitute general market commentary, and do not constitute the opinion or advice of Tradu or any form of personal or investment advice. Tradu neither endorses nor guarantees offerings of third-party speakers, nor is Tradu responsible for the content, veracity or opinions of third-party speakers, presenters or participants.

Bullish continuation?Dow Jones (US30) has bounced off the pivot and could rise to the 1st resistance which lines up with the 145% Fibonacci extension.
Pivot: 40,653.80
1st Support: 39,774.46
1st Resistance: 42,181.26
Risk Warning:
Trading Forex and CFDs carries a high level of risk to your capital and you should only trade with money you can afford to lose. Trading Forex and CFDs may not be suitable for all investors, so please ensure that you fully understand the risks involved and seek independent advice if necessary.
Disclaimer:
The above opinions given constitute general market commentary, and do not constitute the opinion or advice of IC Markets or any form of personal or investment advice.
Any opinions, news, research, analyses, prices, other information, or links to third-party sites contained on this website are provided on an "as-is" basis, are intended only to be informative, is not an advice nor a recommendation, nor research, or a record of our trading prices, or an offer of, or solicitation for a transaction in any financial instrument and thus should not be treated as such. The information provided does not involve any specific investment objectives, financial situation and needs of any specific person who may receive it. Please be aware, that past performance is not a reliable indicator of future performance and/or results. Past Performance or Forward-looking scenarios based upon the reasonable beliefs of the third-party provider are not a guarantee of future performance. Actual results may differ materially from those anticipated in forward-looking or past performance statements. IC Markets makes no representation or warranty and assumes no liability as to the accuracy or completeness of the information provided, nor any loss arising from any investment based on a recommendation, forecast or any information supplied by any third-party.

S&P500: Hit its 4H MA50. Can it provide a price push?S&P500 (SPX) is neutral on its 1D technical outlook (RSI = 52.949, MACD = 19.450, ADX = 31.038) as the index just hit its 4H MA50, which is holding since April 22nd. This is at the bottom of the 4H Channel Up so as long as it holds, the signal is bullish. In the meantime the index again hit the P1 level, which was previously a Resistance. As long as this demand zone holds, we are aiming at the R2 level (TP = 5,790).
## If you like our free content follow our profile to get more daily ideas. ##
## Comments and likes are greatly appreciated. ##

Bullish momentum to extend?Dow Jones (US30) has bounced off the pivot which is an overlap support and could bounce to the 1st resistance that aligns with the 145% Fibonacci extension.
Pivot: 40,653.80
1st Support: 39,774.46
1st Resistance: 42,181.26
Risk Warning:
Trading Forex and CFDs carries a high level of risk to your capital and you should only trade with money you can afford to lose. Trading Forex and CFDs may not be suitable for all investors, so please ensure that you fully understand the risks involved and seek independent advice if necessary.
Disclaimer:
The above opinions given constitute general market commentary, and do not constitute the opinion or advice of IC Markets or any form of personal or investment advice.
Any opinions, news, research, analyses, prices, other information, or links to third-party sites contained on this website are provided on an "as-is" basis, are intended only to be informative, is not an advice nor a recommendation, nor research, or a record of our trading prices, or an offer of, or solicitation for a transaction in any financial instrument and thus should not be treated as such. The information provided does not involve any specific investment objectives, financial situation and needs of any specific person who may receive it. Please be aware, that past performance is not a reliable indicator of future performance and/or results. Past Performance or Forward-looking scenarios based upon the reasonable beliefs of the third-party provider are not a guarantee of future performance. Actual results may differ materially from those anticipated in forward-looking or past performance statements. IC Markets makes no representation or warranty and assumes no liability as to the accuracy or completeness of the information provided, nor any loss arising from any investment based on a recommendation, forecast or any information supplied by any third-party.

NASDAQ: Rebounding on the 4H MA50. New High for the Channel Up.Nasdaq is marginally bullish on its 1D technical outlook (RSI = 56.883, MACD = 127.320, ADX = 37.197) and is rebounding today on the 4H MA50, right before the HL of the Channel Up. This is a technical bottom that calls for a buy. We aim for a new +6% bullish wave (TP = 20,800).
## If you like our free content follow our profile to get more daily ideas. ##
## Comments and likes are greatly appreciated. ##

$DJI & $NDX at MAJOR RESISTANCEDaily
The TVC:DJI has done well since April & we noticed a sentiment change. This is why we turned bullish. Only problem? Lack of volume. We can see that volume stayed under the pink dots. This is an average of 90 days.
We can also see this by the Money Flow. As of now the lowest peak since mid March on this indicator.
---
Weekly
The TVC:DJI RSI hasn't broken the halfway point. This is needed for more bullish momentum.
Money flow is slanting lower. The interesting tid bit is that volume for the week is not bad at all. But compare this to Jan 2024 and 4th quarter of the same year... LOWER.
Posted this yesterday, see profile for more info.
