Who's caught the DE30 drop this morning 🙌😀Have we all caught the DE30 drop this morning?
The strategy in use has.
Entry details are shown on the chart.
We're only looking for TP3.
Trade history can be seen below this trade idea too for full transparency.
------------------------------------------
I try and share as many ideas as I can as and when I have time. My trades are automated so I am not sat in front of a screen daily.
Jumping on random trade ideas 'willy-nilly' on Trading View trying to find that one trade that you can retire from is not a sustainable way to trade. You might get lucky, but it will always end one way.
------------------------------------------
Please hit the 👍 LIKE button if you like my ideas🙏
Also follow my profile, then you will receive a notification whenever I post a trading idea - so you don't miss them. 🙌
No one likes missing out, do they?
Also, see my 'related ideas' below to see more just like this.
Interested in access to my strategy so you can be in these trades the moment they're valid? Drop me a DM .
The stats for this pair are shown below too.
Thank you.
Darren
Indicies

Back in a US30 sell position. Is anyone else 🙋♂️🙌This US30 strategy yesterday had a successful long position hit TP target.
A few hours later an alert for a sell position presented.
Currently in a bit of draw down but lets see how this one plays out.
Entry details are shown on the chart.
We're only looking for TP3.
Trade history can be seen below this trade idea too for full transparency.
------------------------------------------
I try and share as many ideas as I can as and when I have time. My trades are automated so I am not sat in front of a screen daily.
Jumping on random trade ideas 'willy-nilly' on Trading View trying to find that one trade that you can retire from is not a sustainable way to trade. You might get lucky, but it will always end one way.
------------------------------------------
Please hit the 👍 LIKE button if you like my ideas🙏
Also follow my profile, then you will receive a notification whenever I post a trading idea - so you don't miss them. 🙌
No one likes missing out, do they?
Also, see my 'related ideas' below to see more just like this.
Interested in access to my strategy so you can be in these trades the moment they're valid? Drop me a DM .
The stats for this pair are shown below too.
Thank you.
Darren

NASDAQ100 - WOULD LIKE TO SEE PRICE SELL OFF (NEXT BUY ZONES)BEFORE -
Use our analysis as a sentiment
Analysis is only 1 piece of the puzzle 🧩
Our analysis is a sentiment for the upcoming week, month.
Use this as a weather forecast, you are the person that has to put on a jacket when it’s raining.
Trade this sentiment based off your own entry strategy at the right time.
Flow with the Devil 😈
Trade with the manipulation👾
STAY UPDATED BELOW!

US30 buy currently running. Hands up who's also in buys 🙋♂️Entry details are shown on the chart.
We're only looking for TP3.
This trade has already gone close but we stick to the plan.
Lets see how the rest of this trade plays out.
Trade history can be seen below this trade idea too for full transparency.
------------------------------------------
I try and share as many ideas as I can as and when I have time. My trades are automated so I am not sat in front of a screen daily.
Jumping on random trade ideas 'willy-nilly' on Trading View trying to find that one trade that you can retire from is not a sustainable way to trade. You might get lucky, but it will always end one way.
------------------------------------------
Please hit the 👍 LIKE button if you like my ideas🙏
Also follow my profile, then you will receive a notification whenever I post a trading idea - so you don't miss them. 🙌
No one likes missing out, do they?
Also, see my 'related ideas' below to see more just like this.
Interested in access to my strategy so you can be in these trades the moment they're valid? Drop me a DM .
The stats for this pair are shown below too.
Thank you.
Darren

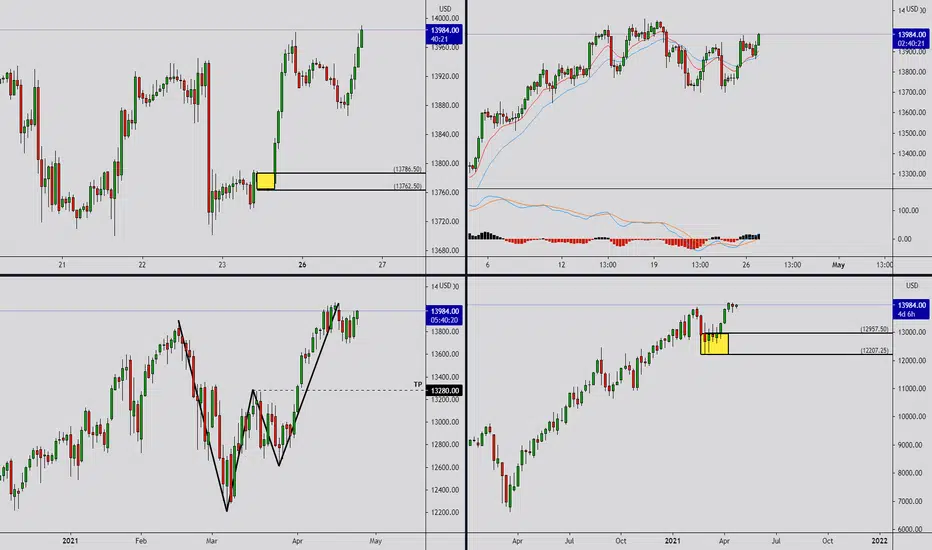
NDX LONGSDouble bottom on the daily as expected took shorts from the double top on the 4H. Take profits when happy. This is all based from a technical POV. Investors still have inflation at the back of their minds so take profits when happy.

$NQ1! Nasdaq Futures. New patterns loadingStill too early to determine what pattern will emerge from this, but my money is on a possible bear flag. Support held well thus far, but if that bear flag (IF it's confirmed) emerges, will have another few % potential downside to support lower down. No position currently, but watching and waiting for confirmation.

SHORT POSITION MEMBERS TOOK TODAY200 plus points collected today trading one of my favourite patterns. Message me to be a part of the team. It's free

NAS100 BUYShorts went perfectly to plan and my members profited. Now we accumulate our buys. Book profits when happy.
TP1 13324
TP2 13664
SL 12980


$NQ1! Nasdaq Futures. Close to supportNasdaq futures is close to the upward sloping support line dating back to Nov 2020. We are not there yet, but I suspect a little bounce off this level. Sentiment seems to becoming more negative by the day, and if support on this trendline does not hold, another 5% downside potential is on the table. I would be careful into being lured into exposing myself too much on the long side with the expected bounce. My expectation is that a very hot tech market could unwind a bit in coming weeks/months. Trend line support is key and something to keep an eye on.
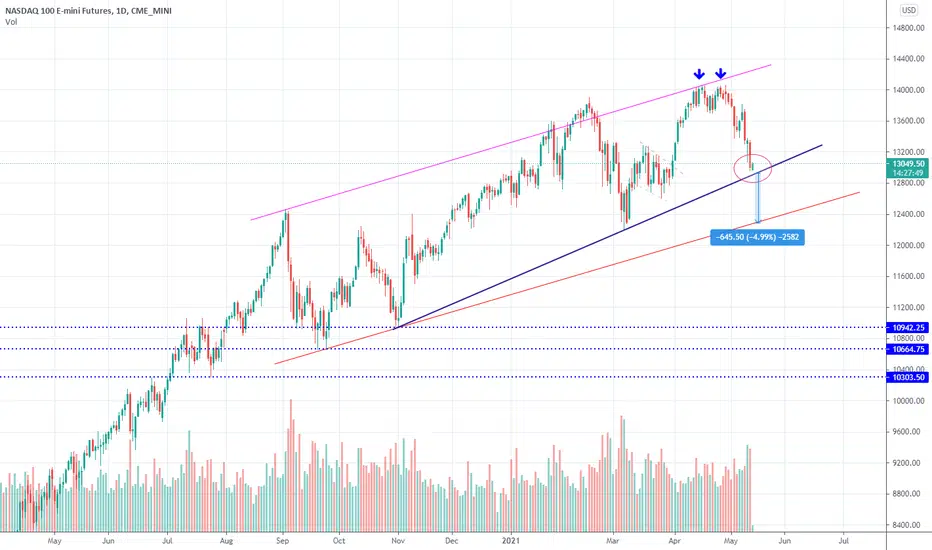
Nasdaq Falls on Mounting Inflation Fears The Nasdaq composite took a sharp dive yesterday as tech stocks continue to reel from growing inflation fears. The newly developing downtrend is likely to probe even lower in the near future as the global recovery heats up.
This downtrend is emerging from the Double Top pattern just above the psychologically significant resistance level at 14000.00. Moreover, the breakdown occurred from an Ascending Wedge pattern, making it an even more prominent bearish movement.
The price action went on to break down below the resistance-turned-support level at 13550.00, which represents yet another major bearish indication.
Notice that the initial breakdown (below the Wedge) was held back by the 100-day MA (in blue). Afterwards, the price action established a throwback to the lower end of the Wedge from below.
Once the downturn was renewed, the price action penetrated below 13550.00 and is currently testing the 200-day MA (in orange). This floating support represents the last potential turning point for the downtrend, making it a last resort for the bulls.
Unless a major rebound takes place immediately, the price of the Nasdaq may fall as low as the next major support at 12800.00, or even the 23.6 per cent Fibonacci retracement level at 12284.99, before the IXIC finds the necessary support.
At present, there doesn't seem to be any potential catalyst in sight that could prompt such a rebound.


$NQ1! Nasdaq Futures. Double Top ? Maybe, maybe not. Market do however look a little tired here with a lot of good news priced in already (Yes it could also include the good results we've been seeing coming from the tech sector currently). I'm carefully optimistic about the Nasdaq at the moment. It could underperform other markets this year.


RUSSEL 2000 Market Breakdown Analysis!!Hi ,
Indexes are clearly bullish . Untill market shows the opposite reaction we should take consider the current momentum.
Now, we have to find a proper palce to get in the trend. If price tousch the key levels which referred in the charts, hopefully it will be great opportunity to take consider!!
In case of, H&S neckline will be broken, deeper correction can be considered!!
Note: the posts are not investment idea

NASDAQ Market Breakdown Analysis!!Hi ,
Indexes are clearly bullish . Untill market shows the opposite reaction we should take consider the current momentum.
Now, we have to find a proper palce to get in the trend. If price tousch the key levels which referred in the charts, hopefully it will be great opportunity to take consider!!
Note: the posts are not investment idea

NG1! Nasdaq futures. What's next ?The Nasdaq has been selling off in the last couple of trading sessions. On the Friday trading session it did however put in a stellar performance to cap what looked like a potential big down day. That initial move on Friday triggered many trailing stops and stop losses (I was stopped out of one of my holdings for instance), and buying pressure followed clearing the way for a bullish looking candle right on the neckline of a head and shoulder formation (bearish).
Although Nasdaq futures are currently trading down, previous experience has told me not to underestimate the power of a fake move (like the Friday move) right in the center of a decision point like a neckline. These moves can trigger a strong squeeze action on short positions (or long), so much so that the initial bearish pattern( head and shoulders) falls apart completely.
Caution is advised on big new positions at this point and I suggest to sit tight for at least 2-3 days to establish if the up trend or downtrend will continue.

US100 Weekly Prediction?Anyone still bullish on indices or do you think we'll see more bearish momentum throughout the week?
Let me know in the comments, happy trading 🔥📈

BTCD ANALYSIS / PREDICTION - RALLY vs ALT SZNImportant to keep an eye on Bitcoin Dominance. Alts have been doing great while it's trended lower, but now it's reached the bottom of a macro ascending triangle and looking for support.
I've outlined 2 possible scenarios.
One - BTCD rallies and continues to range in the pattern. Bullish for BTC, Bearish for Alts.
2. BTCD rolls over, and Altcoin season ensues.
Indicators on the 1D TF seem pretty bullish for BTC, at least in the short term, but we'll have to wait and see how it all plays out.
I don't think this bull run is over, but you have to shift focus from BTC to alts and vis-versa and keep an eye on BTCD and TOTAL2 market indices so you don't buy or sell at the wrong time.
happy trades
CD


#NASDAQ . TRAGET AFTER IT CLEARS RANGEFEB 2ND 2021:
NASDAQ: seems to be ranging between 13351.6 and 13402.8.
If it fails to reverse than we can see it reaching a higher target at 13556.3
