Gold - Retest or fake break ?Clearly at a decision point. A fake break will probably dictate a risk off approach to equities. A retest and further downside will dictate a continuation of a risk on approach towards equities.
Indicies

#ALSI Rising wedge fake breakoutIn true ALSI fashion we had a fake breakout of the rising wedge. Now it's breaking down below with a 400-500 target below. (Unless we get another fake break)

#ALSI An attempt by the bulls to break out of this rising wedge Bulls trying to break to the upside, but will this break succeed ? A failure on the break could see some weakness creeping in. Fro fake moves comes fast moves. Verdict still out on this one.

S&P 500 Bull flag target reachedThe bull flag break out target on the S&P 500 has been reached. Consolidation expected.

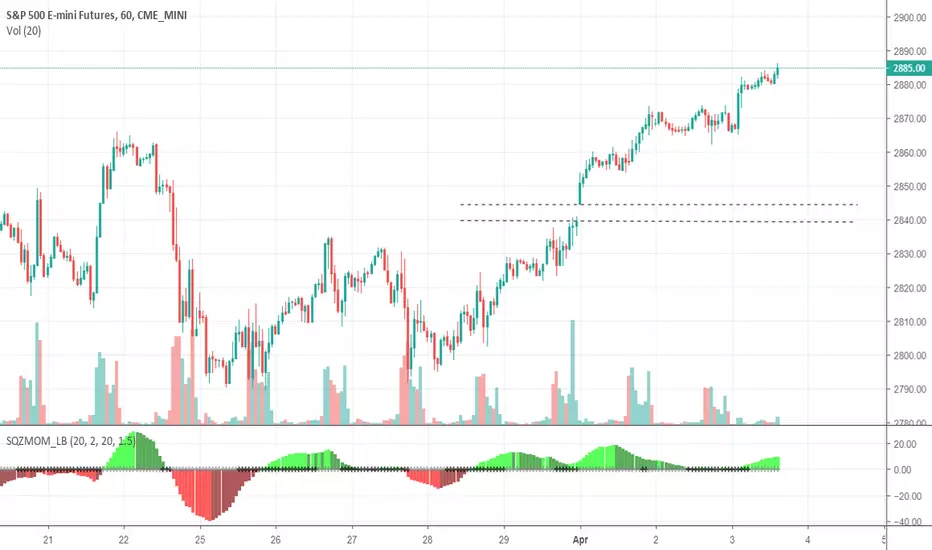
This gap should be a bit of a red flag for the bulls right now.It won't stay open for long. Big target for bears right there.
#J211 JSE Industrial Index hitting resistanceLooks like resistance in this channel is holding. Take care in taking new positions in this sector.

#ALSI All Share Index. Walking on a high wireBalancing act right now. A failure at this lofty level could inflict some pain to the down side. Play the long until it breaks, but be aware of the mounting risk. Bulls always climbs a wall of worry, and this is a big one.


Coffee Futures (KC1!) long.Targets and stops on the chart.
Don't forget to like and follow.
Thank you.

All Share - Bull flag break ? Crazy as it seems at these lofty levels, this look like a bull flag break with a target of around 58k. Overhead resistance also broke with a retest of support on a shorter time frames. 1000pts to go.

DAXMy favourite instrument to trade if i had to pick only one it would be this index.
Anyway just sharing analysis and plus something for me to look back on entered 2 positions so far today on the short, we could see a retest above on the monthly zone before that drop but as for now I am in.
TP1 and TP2 are there for the long term bias, however for the week 10300 and 11000 is more realistic for now. But overall it would be nice to follow and look back on the analysis end of the month and see if it was correct and to journal and note.

SPX to a bear runThe break of this counter trend trade must bring us to the 200 ema in the next week, try to catch the blue zone for sell, but this counter trend line must be enough if the price dont go to 2800, lets see how this one play for a long term trade and minimum risk. Beautiful picture.

#DJIA +21% in 70 days. Sustainable ? Take care in taking long positions at these levels. Consolidation overdue.

#ALSI ResistanceBe careful in taking new long positions. Bulls had an incredible rally, but for me it's time to be cautious. I have mentioned this before and I maintain this position. Time for consolidation is overdue.

$JSEJ211 Industrial Index 25. Top for channel Looks like me might be headed for the bottom of this channel next. All share will follow due to the heavy weighing of this index.

#ALSI Close to resistance Time to start becoming cautious again. We are in over throw territory here. Take care when committing to new long positions.

bazzman78tv - FTSE UKX level to watch W.C 12/02/2019Hi there,
The way i see things (purely my opinion only), technically it makes sense to me why there has been a rejection late last week of the recent rise up.
You may be asking - what is in the way for resistance levels? Well,
We have
- September low (red horizontal line)
- November high (red horizontal line)
- 50% Fib from recent low/high in the way
It is quite possible we may see some weakness next week - based on my daily chart review.
Notes:
Green line = 500 day SMA
Black line = 100 day SMA
Yellow Line = 200 day SMA
Red Line = 55 day SMA
I only use one indicator being the slow stochastic indicator.
No dramas.
bazzman78t
09/02/2019

Bazzman78t - First official post on TV, SPX500 for W.C 12/02/19We all have different ways of analysis and reviews - and i know there is no one right method. Here is my first share and post.
This is my take on the week ahead for the SPX500 (week commencing 12 February 2019).
Interesting resistance levels to watch - as shown on my WEEKLY chart.
55 day MA in sight
61.8 fib from recent low high
Notes as part of my normal chart setup:
Green line = 500 day SMA
Black line = 100 day SMA
Yellow Line = 200 day SMA
Red Line = 55 day SMA
I only use one indicator being the slow stochastics.
No dramas.
bazzman78t
09/02/2019


#DJIA We are in a very precarious spot. There has been a lack of momentum above the 200 day weighed moving average. If weakness continues today, we will most likely end up with a bearish inverted hammer on the weekly. This is not the type of set up where you would want to add to current positions. Strength was likely driven by retail investors and not institutions. A correction in a bear market.


FTSE 100. Charts don't lie. Breakout and retest. Looking bearishFTSE 100 chart looks like it already made up it's mind. #Brexit

All Share - Think we still have some upside potentialTechnically I sill think we could still see more upside before a proper resistance level is reached. Cautiously optimistic.
