Russell 2000 USA lot is going on in here and a lot needs to be taken out to reach this bearish scenario to take place, but YES! it is possible and I am going in for this with stop at 1645/50. This needs at least 2 weeks bearish trend to play out for the price to reach 1460 Area or maybe just maybe if the markets get stretched than 2nd Quarter will be my target. The graph is self explanatory so i wont go into detail but Fingers Crossed. based on last 3 months action this does look attainable.
Indicies

Hang Seng - Key levels to watch for. Trading opportunitiesHang seng has been sold in line with Chinese equity markets and global equities markets due to trade tensions with US. As these start to subside, and market awakens to the fact that both countries look for win-win agreement equity markets should rally in the near term. Larger moves can be made if key technical levels are broken as highlighted in the chart.
Good trading to all.

What's With These Jobs Numbers? - Market Pop on Fake News?Where are these jobs numbers coming from?
On 5/4, the latest U.S. jobs report came out showing unemployment at 3.9%(?!?) with 164,000 jobs added and wage growth virtually nonexistent.
The market (DIA) couldn't decide what to do with that news early on, but Apple (plus tech overall) and energy (stocks like RIG ) were credited with lifting the indices higher, and traders ultimately deciding the jobs report shows inflation being held at bay.
Thank you for lending me your attention!
But if the market pop is on low unemployment (fake news) and staved-off inflation (short-term reprieve from the inevitable), that's not going to prop the market long.
How is that 3.9% unemployment even calculated?
Without going into details, the way unemployment is calculated has changed over the years. Many experts will tell you that if unemployment was calculated as it was back in the 90's, the number would be much, much higher. Even still, I believe unemployment has been miscalculated for a long time - presenting numbers lower than what is realistic - and a claim that unemployment is below is 4% is outrageous.
The jobs environment is desolate, especially for young people. Not only is entry-level pay below livable wages, but a massive amount of jobs are ready for replacement by automation. More and more people are dropping out of the workforce, and record debt levels are coming to pass as the U.S. population is forced to turn to credit - rather than a paycheck - to maintain an acceptable standard of living.
Peak earnings, slow global growth, fake jobs news, a destitute situation for young and old workers alike - the short term (questionable) news can't change the nature of reality, and if there is something that can legitimately send the markets higher, it's not - and won't be -jobs.
Please like, follow, and share, and maybe we can have fun and do great things together.
Thanks again!
See it on the site: holsturr.com/category/markets/charts/
** For speculative and research purposes only - good luck! **

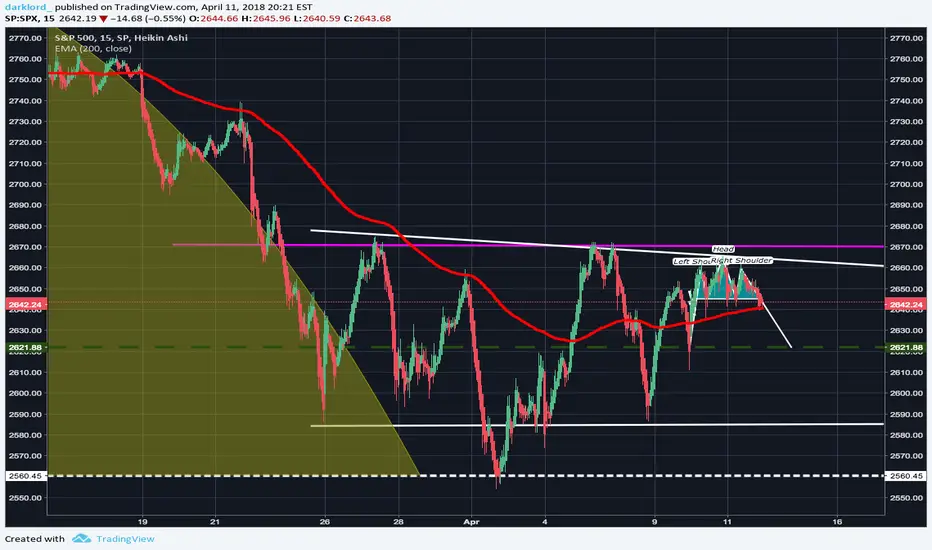
The beggining of the endBig head and shoulders. If you where following my live trading today we tracked the right shoulder on its way up. Heres a nice setup with a 3% possible upside and a stop around 1% loss. I will be updating it as I go along.
TRADE TYPE: LONG
ENTRY: 2676.67
TARGET 1: 2608 (Sell 50% of position)
Target 2: 2589 (Sell 30% of position)
Target 3: 2536 (Sell 20% of position)
If this was helpful to you then swing me a like and a follow!
PLEASE COMMENT
If you disagree... lets debate!
If you agree... let me know!
If you don't understand... ask a question!
I love me some discourse
Happy trading
The droopiest ballsack in town,
Darklord

DONT GET CAUGHT IN THE BULL TRAP. SHORT SPXAs you can see we have continued our way printing that nice thicc inverse head and shoulders. We had little bit of a run up yesterday and suddenly the media sentiment shifted.
DONT GET CAUGHT UP IN THE HEADLINES.
Apple will not save you, Boeing will not save you, the fed will not save you.
The top has blown off. Dont pay attention to the bull trap!
Keep your shorts and lets make some money.
Scoopity Poop
Poop De Woop
Poop Scoop
Darklord_

Undervalued company with GREAT financials! FREE VALUE PICKHeres some easy money,
Navios Maritime Midstream Partners L.P. is a services and shipping company.
It has been priced at a premium by the market as a result of overreaction to selling of ships.
These ship sales have increased the company's cash flow and helped them build an already extremely beefy balance sheet.
I believe the market has priced NAP at around a 30 percent premium.
You shall see in due time
Peace out plebs
(Happy free trade sunday!)
Darklord_

DAY TRADING SPX. Call StreamWelcome to live trading. I will be making calls throughout the day on the index. Like the post and follow me to tune in and get notifications of my calls.
Lets go boys,
Ya boy
Darklord

US Equities Consolidating, Expecting Continuation 4-25-18The Dow Jones has been technically accurate. It is printing a rectangle, which is either a continuation or reversal pattern. Aggressive traders may wish to short at the top of the rectangle for an expected continuation breakout below toward the strong support and price targets below. Otherwise, trade the breakout, whichever direction it is (up is always possible).

I let my nuts hang. See you in the bear merket.Bulls iffy, uh, Blicky got the stiffy, uh
Got the blicky, uh, drum, it holds fifty, uh
Scum Gang!
I'll see y'all later, suuwoo!

Russell2000Lookiing for support at 200MA, needs to hld 1550/1560 to continue the bullish upward momentum.

Ayo. Intraday charts only boiii. Ayo
was poppin
just a lil intraday lookings. Did u know patterns are fractals? Trippy bro.
We printed a nice head and shoulders and confirmed below the baseline. We going down from here.
but heed my warning plebian
for I am the prophet
everyday the bear creeps slowly in
for soon we will enter a downtrend...
but for now be on the lookout for a whole lot of downside tm, maybe mix in a bear flag or 2
Thats all for now
Itsyaboy
Darlord
Trump thinks his daughter is HOT, and I am SHORT on SPX Dar_klords Daily Update
Ticker: SPX
Rating: Sell Short
Driver 1: The white dotted lines on the chart represent the two current major levels of resistance. Both of which are supported by a double bottom.
Driver 2: The pink line shows us another double top, also a bearish signal.
Driver 3: The green line shows us a critical point in the True Strength Indicator. I would make the argument that a move breaking that green line on the downside could send the index
Driver 4: The solid white lines show us where a descending triangle is printed. A break resistance in solid white would most definitely lead to the formation of a cup to the last and largest driver
Driver 5: Large cup and handle on the downside. If a handle prints as a result of a break on the descending triangle we will most definitely see new lows.
Why is this a critical point in the market? Well first off the PE 10 (Market multiple price to earnings ratio) is trading at around 32. This shows us that the market is overvalued equities. In fact the last time we saw market multiples of this level was around 1995 during the dot com bubble. The Tax Cuts and Jobs Act has overheated the equity's market through over optimistic investor sentiment, share buybacks, and ultimately tax deduction reliant balance sheets.
That’s all for now,
I will update throughout the day for you plebeians
This baby's going down
-Dar_klord
P.S suck my balls
SPX

Decision DayDecision day, a drop today should confirm testing off lows next week.
Every push up gets sold off.
Volume picking up to the downside.
Tight SL on this trade, GL

FTSE shortStill some downside. Expecting price to reach the 6940 s/r zone. This zone also correlates with the 0.38 fib retracement on the monthly chart. Will wait and see what happens.
Self explanatory.

Silver Mid-term Short OpportunityHello Traders,
Today we would like to present you TVC:SILVER as it seems to decline in near future. Let us break down the analysis.
Starting with the fundamentals/macro overview as usual:
TVC:SILVER is currently not a very much watched instruments in the financial market, however it shows some interesting pattern. These pattern we would like to provide you.
As TVC:SILVER is in our trading watchlist for commodities combined with TVC:GOLD for the precious metals, it may shows some capital outflows coming in near future for mid-term.
After President Trump will talk in front of the congress by 2:00AM gmt in which he may give a statement of his tax reform and budged plan. "World financial markets will be scrutinizing the 9 p.m. address in the House of Representatives for specifics of how the Republican president aims to make good on promises to tackle tax reform, boost infrastructure spending and simplify regulations he says are harming business." (source Reuters) His content of the speech and tone will be important. He says to bring "one of the best tax reforms which the U.S. had in quite a long time."
In addition markets predicts with a probability of 62.0% vs. 31.0% (yesterday) a rate hike of 25 basis points. This may confirm bearish sentiment towards precious metals as we currently see in TVC:GOLD as well, as it forms our well said bearish pattern.
However, keep in mind that the speech by President Trump at 2:00AM gmt could completely change the picture in worst case.
As we look at our intermarket indications we we get confirmed with our statement, as they currently warn for a big upside moves on mid-term. They mention a short-midterm outflow of capital!
We always mention the importance of intermarket flows, as we believe that investors only repark their money due to sentiment and global macro-economic conditions. Therefore, we always keep in mind the in-and outflows with the help of our intermarket indications that lead us towards better timing when making a trading decision. As you might know that timing is one of the most important things when it comes to trading.
As seen in the chart, our two of our intermarket indications showing a divergence and currently moving in selling territory which might indicate a soon outflow of capital towards other asset classes. One of them is currently turning south ( Silver vs. Currencies). We take into regard always the BIG 4: Currencies, Bonds, Stocks and Commodities.
Looking at the technical perspective and current trading range, we see a clear trend channel in where TVC:SILVER currently moves. However, it currently flirts with a decisive zone (our 50% Resistance Level). Around that level it will be decided what trend direction we see next. As market bounced several times at the drawn trend line above that red drawn decisive range, we might see sooner or later trend reversal patterns. Together with all our analysis, this might confirm our standpoint that TVC:SILVER might move to the downside (first turquoise box or further to the second turquoise box) before continuing long term bullish trend. This move may be initiated in the next 0-3 weeks. If we see a bearish pattern we might take advantage of getting at least a 4:1 Risk/Reward out of the trade.
So, summarizing everything together, we believe that TVC:SILVER might fall to the downside at least on mid-term before continuing long term bullish trend. This underlines our intermarket indications that are currently diverging bearish. The fundamental perspective may give Silver a driver to to potential bearish sentiment around the decisive territory as we soon get interesting trading setups.
We wish you much success,
The Secrets2Trade Team

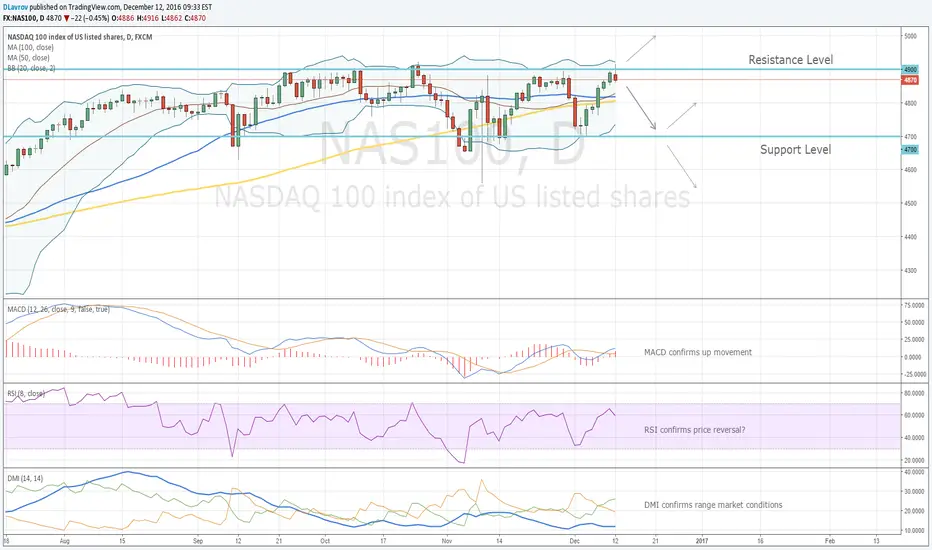
NASDAQ Trading IdeaThe level 4900 is a place for making decision how we have to trade. Let's think about possible price movements. If the close price of this day is above 4900, we'll have price reversal from the support level with RSI confirmation. MACD histogram will support up movement. At the same time rising MAs with periods 20, 50 and 100 give a signal that up trend begins and we can open long trades. If you wait for rising ADX, you will get additional confirmation of such up movement. If price moves below 4900 and ADX stays below 20, we'll have range market conditions. Short trades will be reasonable.

NASDAQ Trading IdeaPrice reached the important resistance level 4900. We have 2 possible variants for trading in this zone. If price bounces from the resistance with RSI confirmation, we'll have to open short trades with profit target near the support level 4700. DMI confirms range market conditions and price reversal from the resistance level looks more realistic. If price breaks 4900 level, we'll have to search entry levels for opening long trades. MACD shows up movement and if ADX line starts rising, it will be good confirmation for possible breakout. If price breaks 4900 level, profit target will be near 5000 level.
GER30 Trading Idea Price bounced from the support level and MA20. RSI confirms price reversal and MACD gives a signal for opening long trades above 10580 with target near 11000. Stop order should be placed below the support level. If ADX starts rising, it will be good confirmation of up movement.

NASDAQ Bearish DivergenceWe have to open short trades because:
- price reversed from the resistance level
- RSI confirms price reversal
- Double Top or Triple Top chart pattern
- Bearish Divergence was formed by Price and RSI
- MACD gives a signal for opening short trades
- ADX falls and allows open short trades
To my mind we have solid arguments for opening short trades. Don't you think so? Entry level is below 4785, stop order should be placed above the resistance level. The 1st profit target is MA50 and if price breaks this line, the 2nd profit target will be MA100.

NASDAQ Price ReversalPrice reached the resistance level 4838 and reversed with RSI confirmation. MACD gave a signals for opening short trades below 4810. DMI confirms range market conditions. Stop orders should be placed above the resistance level and take-profit orders near Bollinger Band. And tomorrow probably we'll have a reversal pattern on the daily chart.


NASDAQ Weekly ChartWe have a very clear signal for down movement. Price bounced from the resistance level with confirmation from RSI and MACD. ADX is below 20 and confirms range market conditions. DMI allows open short trades. Entry level can be below 4756, it's the low of the signal candle. Stop should be placed above the resistance level 4838 and profit target is near the possible reversal zone. You can also open short trades based on the daily chart with the same stop and profit target levels.

NASDAQ Open Short TradesOn 1H chart we have trend market conditions and we can trade. Price touched MA20 and bounced. MACD confirmed price reversal and gave a signal for opening a short trade. Entry level is below 4774, stop should be placed above the swing high. Our profit target is based on R/R ratio 1:3 and we use no more then 1% from our deposit for this trade. We have the support level which can stop or reverse the market, but on the daily chart MACD falls and confirms short trades.
