NASDAQ BULLISH OUTLOOKThe Nasdaq 100 witnessed a robust recovery driven by investor enthusiasm surrounding the future of artificial intelligence (AI). This surge followed the launch of Google's cutting-edge Gemini AI model, generating positive market sentiment supported by analysts' favorable remarks. Simultaneously, market speculations about potential changes in the Bank of Japan's monetary policy saw the yen ascend while the dollar dipped.
In a swift market overview, the Nasdaq 100 rose by 1.5%, countering a three-day decline in the S&P 500. This surge in tech stocks like Alphabet (GOOGL) and AMD (AMD) reflected the bullish sentiment surrounding AI's anticipated role in future economic growth.
Key insights revealed a pivotal role for AI in driving economic growth beyond 2024, with investors speculating on potential central bank rate cuts in the coming year. Notable corporate developments included setbacks for Tesla's self-driving technology efforts and Dish Network's (DISH) significant stock surge post-FCC approval of its merger.
Looking ahead, market focus gravitated towards forthcoming economic data releases. Events like Germany's CPI and Japan's household spending and GDP data were anticipated alongside the US jobs report and University of Michigan consumer sentiment. These data points were expected to guide future economic and market directions.
The most recent US jobs report, indicating nearly 200,000 new nonfarm jobs in November with stable average earnings, bolstered market optimism. Although the report showed a positive labor market, it raised concerns about inflation due to higher average earnings, pushing yields higher. However, investors remained cheerful, interpreting the data as a sign of a softening, rather than collapsing, job market.
The Federal Reserve's stance on inflation and future rate decisions became a focal point for markets, with speculation around potential rate cuts in the coming months. The markets awaited signals from the Fed to gauge its approach in balancing inflation and economic growth.
The overall sentiment was cautiously optimistic, with markets closely monitoring developments in AI, central bank policies, labor market dynamics, and upcoming economic data releases to navigate potential market shifts in the days ahead.
On the technical side, both MACD and RSI are showing BUY signals, with possible target of 16307.48. If the trend reverses, as pivot point might be considered 16040.98, from where the price might drop to 15818.18.
Risk Disclosure: Trading Foreign Exchange (Forex) and Contracts of Difference (CFD's) carries a high level of risk. By registering and signing up, any client affirms their understanding of their own personal accountability for all transactions performed within their account and recognizes the risks associated with trading on such markets and on such sites. Furthermore, one understands that the company carries zero influence over transactions, markets, and trading signals, therefore, cannot be held liable nor guarantee any profits or losses.
Indicies

NasDaQ's New Highs & Next MoveNasdaq pushed up pass July's highest price last week. We want to keep an eye on it this week to see if there will be more buys to push price higher.
The only thing that can invalidate this setup is if the inside bar's or past sellers attempt to push the market down fails.
What do you think will happen next? Will the buyers keep price going or will the sellers come in strong?
*I love doing these videos so like the video and boost it to let me know if you like them too.*

NDX should bottom 6th of NovemberA lot of technical confluence to suggest a bottom of this move on Monday the 6th.
You have the 0.618 fib channel, 0.382 horizontal fib retracement, and 1.618 fib time-zone.

GER30 / DE30 Bulls are back! (for now...)clear break of structure here, higher highs and higher lows, following my fib levels for possible targets. European inflation came down this last month aswell, perhaps europe is healing?
2hour chart! not calling a perma bull or perma bull market.
cheers

NASDAQ LongI've a small long running from the low we just put in, but considering the news events on Thursday and Friday, it wouldn't surprise me to run the lows.
The first level is my favourite front-run confluence, and has tight invalidation. This trade could be stopped out with a ltf wick, so i'm planning to enter partially with limit order and add to position after confirmation.
The second level is a text-book confluence for C wave to finish. Safest entry is typical SFP rather than limit orders, but you must be prepared for a front run, or multiple SFPs.
A strong break below these two targets will send it down to 13880-13850 imo

$DXY -Resistances to Watch *D (tf)- Upcoming Resistances to watch for TVC:DXY :
-104.707
(Last Lower High + confluencing S/R area)
-105.883 (Lower High from 114)
(aswell being drawn a Range's Ceiling
- The Dollar Index TVC:DXY has experienced lots of tremendous
vertical upside during these past two-three weeks.
From negative economic news of Chinese CCP report ;
to US economy on Sticky Inflation
and persistent outlook of Interest Rates being Hiked again,
seems as investors, smart money and quite of many retail traders are fleeing in to
TVC:DXY given safety.
Meanwhile TA speaking,
TVC:DXY has been broken Resistance Trendline from 114 High after occuring a FAKE-OUT
at the Bottom Support of Range (100.8) level.
Price went to close to the Weekly 200EMA,
which seems to have provided lots of Support for TVC:DXY
by pushing the price higher .
TRADE SAFE

$DXY - Middle Range Warzone (100-105) - TVC:DXY has had a vertical rally from its fake-out breakdown of Range,
finding Support at 200EMA and got back to the Middle Zone Range S/R of 103 level.
The last idea published when TVC:DXY broke the range to the downside
( TVC:DXY -Headed South 97) played out in the opposite way of forecast expectation.
Eerie similar bars pattern move but on North direction, not South. (press play for bars)
With TVC:DXY currently closing the week at 103.4 level,
looking for short-term weakness next week to correct a bit from the Rally starting
from 99.6 to 103.
Next Resistances to look out for ;
- previous Macro LH @104.7
- Range's Ceiling 105.9
- Strong Resistance level at Macro Fibbonacci taken from 114 High to 100.8 Range Low
(0.618 Golden Zone @ 106.1)
Clearing these upcoming Resistances,
would put TVC:DXY clear bullish territory for the rest of 2023 and 2024.
Trouble times ahead for Financial Markets in this case scenario,
especially when combined with the Chinese Real-Estate Panic that just started on Friday with
Evergrande declaring bankruptcy
TRADE SAFE !
*** Note that this is not Financial Advice .
Please do your own research and consult your own Financial Advisor
before partaking on any Trading Activity based solely on this Idea !

$DXY -Middle Range Warzone (105vs100)- TVC:DXY seems to be wanting a break-out from Resistance Trendline
coming from 114 Highs, despite failing to do so.
A Resistance Trendline that has pushed the price lower each time price has approached it.
Wether that break-out and resumption is bound to happen or not in the short term,
it is yet to be seen.
Currently, TVC:DXY is in the midst of a Middle Range War-Zone, struggling for direction.
For now, Price-Action suggest a Lower High being printed
at 104.5 , a Lower High from 114 Downtrend.
By Breaking Structure(BoS) of the most recent Lower High (LH) 104.5
would validate the Trendline break-out and suggest
furthermore uptrend continuation for TVC:DXY ,
headed for the the Range's Ceiling at 105.8 and testing the broken
macro structure Support Trendline
Move towards 105.8 range's ceiling would be quite bearish for overall Financial Market's
condition.
While a move to the range's bottom at 100 level would be quite promising for other Market Sectors
to continue performing well.
Very interesting week ahead for The Markets, especially TVC:DXY ,
which dictates Financial Markets Swings
*** TRADE SAFE
NOTE that this is not Financial Advice .
Please do your own Research before partaking on any Trading Activities
based solely on this Idea.

$DXY - Bull Flag *12Hr TVC:DXY - 12Hr* Bull Flag
- TVC:DXY Bull Flag post break-out still valid and in play until Price Action nullifies it.
Breaking the Bull Flag (in green) and the Resistance Trendline (in red) coming from 114 Highs
will confirm another Macro Higher Low in $DXY.
(in play would be the macro wave C putting The Dollar Index at 96)
LH confirmation would give the other Financial Markets sectors room to explode headed to the upside,
stronger then we've seen so far for the year.
TRADE SAFE
*** NOTE that this is not Financial Advice !
Please do your own research and consult your Financial Advisor
before partaking on any trading activity based solely on this Idea .

SPX500 SHORT SETUP H1 BEFORE FED RATESThe price is currently in a bearish moment at the level of 4270, with a potential bounce zone around 4284, which corresponds to the 50% Fibonacci retracement level and a high-volume trading area. The objective of the short trade is to target 4220, where we have the 61% Fibonacci retracement level with high volumes and a demand zone for support before potentially dropping further to touch 4187. A descent is expected in anticipation of the Fed's interest rate hike next week.
Let me know what you think.
Happy trading to everyone.

NASDAQ-100 AND SP-500 NAVIGATING FRAGILE MARKETS- T-bills to be issued by the end of Q3 drain liquidity and have an impact similar to a 25 basis point increase in benchmark rates.
- Further market extension is challenging due to possible overtightening.
- Unemployment data is a significant turning point.
- Unsatisfactory market breadth.
- Significant divergence between Nasdaq and Treasury 2-year.
Hello everyone,
Today I present a couple of ideas regarding the fragility of the Nasdaq 100 and the consequences for the S&P 500.
Firstly, I want to remind you that once the US debt agreement is reached, approximately 1 trillion dollars' worth of short-term Treasury bills (T-bills) will enter the market by the end of Q3, resulting in an inevitable liquidity drain from the stock market. According to industry reports, this issuance of government bonds may act as an additional 25 basis point increase in Fed rates. Furthermore, following the bank failures in recent months, we can expect further deterioration in the credit market, also comparable to a 25 basis point increase in Fed rates.
This leads us to a potential overtightening by the Fed due to the indirect rate increase described above. It will, therefore, be challenging for the markets to grow solidly due to the likely resulting economic contraction. Additionally, recent reports indicate that inflation is decreasing less than expected, and further rate increases by the Fed may be necessary, as dictated by their econometric models.
The unemployment data for this week will be crucial. If it indicates a potential rise in unemployment, we may see a pause in rate hikes, thus mitigating the possibility of a sustained market collapse in the short term. Otherwise, further credit tightening will be necessary, which will have a negative impact on the markets. If another Fed rate hike materializes, we could witness the liquidation of long positions built over time based on optimism about potential rate cuts at the end of the year. Without a year-end rate cut, the possibility of a credit squeeze continuing into 2024 arises, which would be detrimental to heavily indebted companies that will have to consider refinancing ongoing operations at much higher than expected rates. This will have a negative impact on future corporate profits.
We now observe the deterioration in the breadth of the index, displaying a negative divergence with three descending peaks. For the tech rally to continue, we will need further advances in AI-related stocks, the last line of defense before a correction (in the chart, market breadth is indicated in gray, calculated as the percentage of stocks above their 200-period moving average).
Finally, I would like to mention the significant divergence between the 2-year Treasury and the Nasdaq-100 since the beginning of May (in the chart, the 2-year Treasury is represented in cyan, with the axis inverted). I believe that this divergence will be corrected, but since a reduction in 2-year Treasury yields is unlikely, the possibility of a correction in the index remains.
Nice trading,
Cheers

US30 (Week of May21st)The previous idea for US30 still holds. I will still be looking for buys to the upper supply area for temporary or major sells.I will be looking for minor breaks of structure then a retest of the current demand zone to continue higher. I would prefer to get this entry at my trading session (New York), but if price moves up without me, I will look to take sell positions if market presents it self for that condition. Updates will be provided later. Good Luck!

spx500 Analysis Hey guys Looking at spx500 we can see we have some Solid Market Structure in play with some in effeciancies regarding price action and its left behind some imbalance or (gaps) in the market and we may see price action start to fill these gaps
now just because a gap has been created doesn't mean that its going to be filled there after it was created... price may take hours/days/ weeks or even Much longer to revisit these areas and mitigate the Gap
now from what we are currently seeing, looks like we're starting to see price reject somewhat here With the structure we have recently created and/or respected ( Please Check my Analysis for Possible Trade ideas
Disclaimer - past profits don't guarantee a future result... trading is risky and one can loose some or all of their trading capital!
Disclaimer - information shared is for educational and demo purposes only!!

DAX ShortGer30 rejected an area of interest on Daily chart
-strong close at the end of the day
- Afp conditions, going into level 1
-looking for a pullback (high) drop
Strategy - Market maker

NAS About To Make A Move?whats up TV Family!
quick question ? are yall loving the ideas being shared? if so Share some feed back with me on what i can do better to improve your experience!!
In this Analysis i'm looking at NAS100 and i am seeing a Significant rejection starting to take place here, i also see that we have respected this Beautiful uptrend for some time now, and once we see PRICE ACTION CLOSE BELOW the trend i wouldn't be surprised if we didn't see a very quick decline in price towards projected target areas i have drawn up that are high probability reaction areas as its not just a simple support but rather a strong area of interest with A Bullish engulfing OB that have been formed ( both blue boxes show the Bullish Engulfing OB ORder Block on the 1 hour time frame where i anticipate price to come!
Disclaimer - trading is risky and you can loose 100% of your trading balance with incorrect risk management! this is why it is important to master and manage your risk management plan before you even think of taking your first trade!!
i am not a financial advisor and this is not financial advice, please do your own due diligence and market analysis as this is shared for educational and demo purposes!!

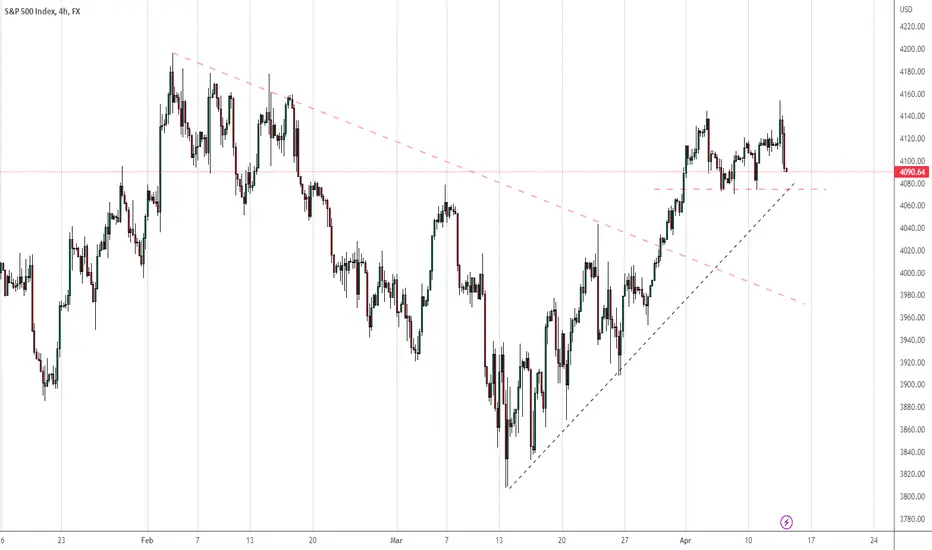
Nas and Snp could be turning down...4080 for snp is a important level to watch..
**Find out more from my Tradingview Stream this week**
***************************************************************************************
Hello there!
If you like my analysis and it helped you ,do give me a thumbs ups on tradingview! 🙏
And if you would like to show further support for me, you can gift me some coins on tradingview! 😁
Thank you!
Disclaimers:
The analysis shared through this channel are purely for educational and entertainment purposes only. They are by no means professional advice for individual/s to enter trades for investment or trading purposes.
The author/producer of these content shall not and will not be responsible for any form of financial/physical/assets losses incurred from trades executed from the derived conclusion of the individual from these content shared.
Thank you, and please do your due diligence before any putting on any trades!
Dollar | What The Heck Is Going On?The dollar has been in a range of consolidation since a new low at 103.30 was made December 14, 2022. This has made trading the majors not the best decision as of late.
What can you do?
The best thing you can do is wait for price to make a new lower low or a new lower high. There is no need in guessing which way the dollar will go until she shows you her hand.
Should you trade?
There are other minor currency pairs with amazing opportunities. You job, my friend, is to go find those opportunities and trade them. Consider looking elsewhere for your trading opportunities following your trading rules.
Or...
Since this is the last trading week of the year you could rest and reflect on your performance this year so you can prep for next year. I choose to do the later of both of these options, but you have permission to do as you wish.
As for now, the dollar is chilling. I'm about to do the same.
Thanks for taking the time reading my thoughts on the dollar. Like this post to boost it. I appreciate you.

NAS 100 I It will rise from support Welcome back! Let me know your thoughts in the comments!
**NAS 100 - Listen to video!
We recommend that you keep this pair on your watchlist and enter when the entry criteria of your strategy is met.
Please support this idea with a LIKE and COMMENT if you find it useful and Click "Follow" on our profile if you'd like these trade ideas delivered straight to your email in the future.
Thanks for your continued support!
Brian & Kenya Horton, BK Forex Academy

InvestMate|DAX Time to fall🇩🇪 DAX Time to fall
🇩🇪 Looking at the last few weeks on the dax, we see quite a bit of unwinding after new lows.
🇩🇪 The dax has already rallied more than 15.40% from its lows
🇩🇪 In my last post where I perfectly predicted the correction that took place last week.
🇩🇪 It was followed by a breakout to new highs but I believe that the correction potential has not yet been fully exhausted.
🇩🇪 It is unusual in a serious long-term downtrend for the price to just keep going higher and higher from a new low.
🇩🇪 Sooner or later a correction comes.
🇩🇪 Is the 13600 level the ideal time for a correction?
🇩🇪 Definitely highly likely in my opinion.
🇩🇪 My assumption is confirmed by the fact that we are in a place where the price has already reversed direction once in the past and that it is one of the more important fibo levels 0.382 of the whole downward wave.
🇩🇪 The correction targets will be 2 levels, one more likely and the other a little less likely
These are the levels 0.382 and 0.5 of the current upward impulse. These are places where the price has found support many times in the past
🇩🇪This is a long-term scenario, I do not even exclude breaking out even higher before the decline.
🚀If you appreciate my work and effort put into this post I encourage you to leave a like and give a follow on my profile.🚀

SP500 levels- sp500 lvls for next weeks
- beware of news at the begin of next month. / see other charts (ETH, SP500 )
- let me just post it here
- imo. pump before nuke.

US30You know what they say about men with big feet..
Wait that's a bit random.
Anwyay, here is what my Outlook is for US30 and Indicies in general

Japan 225 Short M15, M30, H1 and H4 are overbought
There has been a lot of consolidation and structure
No pattern and its against the trend
250 pip stop loss

NAS100 ShortLooking for a retracement at the 4 hour supply which lines up with a strong fibonacci level to continue down around the 11104.8 levels. I am bearish unless the market provides otherwise. We have a lot of fundamentals this week including NFP.
