$IWM target 201$IWM target 201
Still in the neutral zone, with technicals pointing down.
Let me know your thoughts and what you guys are doing.
Have fun!!
——————
I usually trade both ways, but lately I’ve been focusing more to the downside because of how high the market is. It makes more sense to sell puts right now, and I’m usually at Target 2.
——————
I am not your financial advisor, but I will happily answer questions and analyze to the best of my ability but ultimately the risk is on you. Check out my ideas, but also do your own due diligence.
I am not a bull. I am not a bear. I just see what I see in the charts and I don’t pay too much attention to the noise in the news.
Very often you have to look at my charts from the perspective of where I’m looking to sell puts. But I also do open positions still once in a while.
If you want me to analyze any stock or ETF just leave me a comment and I’ll do it if I can.
Have fun, y’all!!
(\_/)
( •_•)
/ >🚀
Indicies

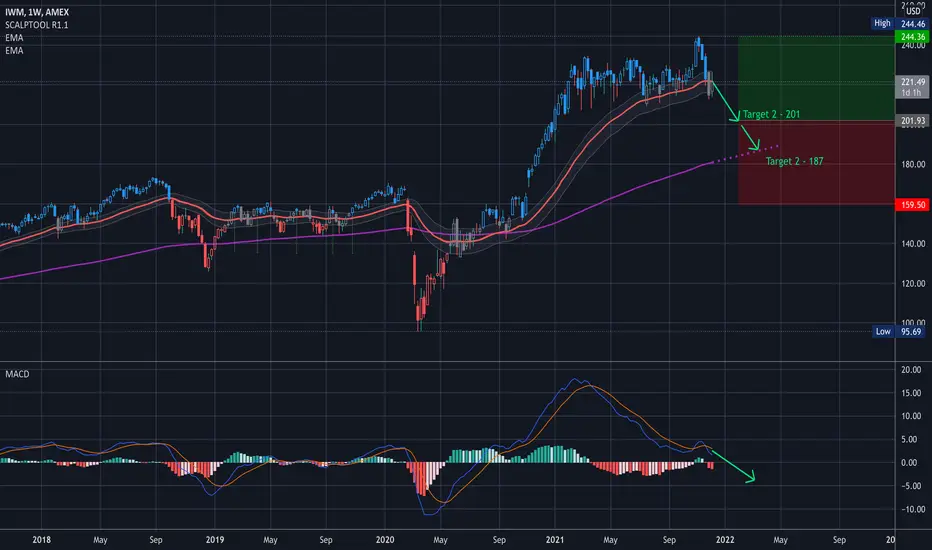
$IWM target 201$IWM target 201
Target 1 was hit beautifully… so taking it out onto the 1W 5Y chart target 2 looks like a nice place to sell puts at this time. I would happily start a position there. Right now it’s kind of in the neutral zone, but technicals are pointing to down.
Let me know your thoughts and what you guys are doing.
Have fun!!
——————
I usually trade both ways, but lately I’ve been focusing more to the downside because of how high the market is. It makes more sense to sell puts right now, and I’m usually at Target 2.
——————
I am not your financial advisor, but I will happily answer questions and analyze to the best of my ability but ultimately the risk is on you. Check out my ideas, but also do your own due diligence.
I am not a bull. I am not a bear. I just see what I see in the charts and I don’t pay too much attention to the noise in the news.
Very often you have to look at my charts from the perspective of where I’m looking to sell puts. But I also do open positions still once in a while.
If you want me to analyze any stock or ETF just leave me a comment and I’ll do it if I can.
Have fun, y’all!!
(\_/)
( •_•)
/ >🚀
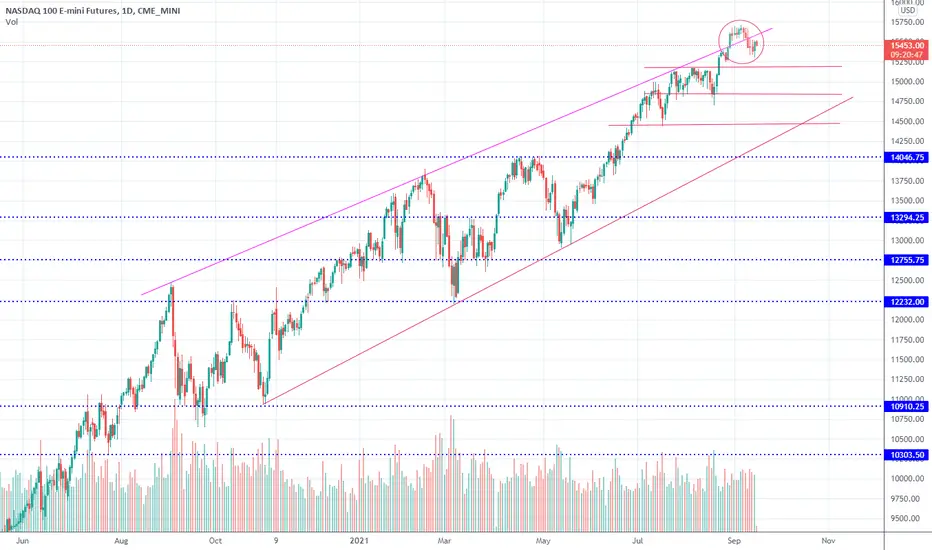
$NQ1! Nasdaq Futures. Possible bounce ? If history is anything to go by, then we could see a little bounce on the Nasdaq. These little bounces usually fades for a test of the support line lower down. Expecting another -4% on Friday's close, but as always nothing goes down in a straight line.
Volatility seems to be the only given right now.
BITCOIN - where to next? My 2 cents worth (December 4, 2021)Hi to all,
I don't trade crypto. In fact i don't care about crypto, or it's future potential or benefits - or what it could do, may do, possibly do, and/or perhaps will be in the future. In saying that, i do observe the bitcoin chart on one of my saved chart templates regularly - particularly over the weekend (for curiosity mainly) - as i love technical analysis.
In my normal weekend analysis i undertake (as per my normal process of weekly review of the trading week that has just gone by), i decided to look into the daily and weekly chart (after the big price action drop today - Saturday December 4 - price currently approx. 47,000 - being an approx. 10%/11% + drop today alone) - as i type these comments.
I note the following on my chart:
Confluence of levels including:
- 61.8 Fib from the July low
- 38.2 Fib from the 2021 low
- Trend Line Support here.
In my opinion (which doesn't necessarily mean anything at all ), it an interesting price action point when observing the longer time frames. A break below here could really accelerate some further down side - clues on the faster time frames should or may provide further indications from here. I would not be surprised either if price holds here also.
Best wishes to all and stay safe.
bazzman78tv :)

us30 shorts finally activeQuick analysis on us30
We have been rejecting from the 36250 key level on the daily timeframe
It appears we are breaking the low of a bear flag formation
I like 36000 to be the first target as a quick trade
but with the bear flag it looks like 35750 is its final destination.
I will be entering this trade on the minute chart (1minute or 5 minute)
Looking for about a 25 point risk with a 75 point profit target or 36000
Then I will attempt to reshort it after the pull back correction with a smaller position down to 35750.
All things pointing bearish.
If we open and pop above 36250 I most likely wont take any position or take my short idea off

@LALPIPS US30 ANALYSIS - NEW YORK SESSIONUS30 seems to be in the middle of breaking its respected support area of 36110.
Once price breaks support (36110), wait for for market price to respect 36110 as a
resistance for 15 minutes then execute a sell position at 36080.
TP1: 36060
TP2: 36040
TP3: 36020
TP4: 36000
TP5: 35980
SL:36180
USE LOW RISK
PATIENCE IS KEY ⏳

US30 short opportunityNow that we are trading at the 36250 key level we are forming a bearish flag under levels of resistance.
I see us in being in a A, B, C elliot wave move down to about the 36100 level where prior support was
I will be looking to enter this trade on the 5 minute time frame for precise entries.

UK100 buy running ⤴️🙌We are using our POW reversal strategy for this trade a UK100 long.
Trade details for current trade are shown on the chart.
We are working the 15M time frame on this strategy.
We're looking for the green line which is take profit target.
Little blue arrow is entry point and purple line is stop loss.
Trade history can be seen at the foot of this trade idea too for full transparency.
Previous trades also can be seen on chart.
Both were long trades and both found TP so lets see if we can go three for three.
------------------------------------------
I try and share as many ideas as I can as and when I have time. My trades are automated so I am not sat in front of a screen daily.
Jumping on random trade ideas 'willy-nilly' on Trading View trying to find that one trade that you can retire from is not a sustainable way to trade. You might get lucky, but it will always end one way.
------------------------------------------
Please hit the 👍 LIKE button if you like my ideas🙏
Also follow my profile, then you will receive a notification whenever I post a trading idea - so you don't miss them. 🙌
No one likes missing out, do they?
Also, see my 'related ideas' below to see more just like this.
The stats for this pair are shown below too.
Thank you.
Darren

US30 PREDICTIONSI like US30 bc it respcts major support and resistance really well, marking up this up on a sunday morning at 5 am before market opens i was thinking another drawdown on price before creating that new new high marked by a fib level resistance

UK100 long running 📈👏Trade details for current trade are shown on the chart.
Trade has been live since 7:15 UK time and we are using our POW reversal script.
We are working the 15M time frame on this strategy.
We're looking for the green line which is take profit target.
Little blue long arrow is entry point and purple line is stop loss.
Previous trades can also be seen on chart one found TP one found SL which was covered in an idea Monday.
Lets see how this trade plays out.
Trade history can be seen at the foot of this trade idea too for full transparency.
------------------------------------------
I try and share as many ideas as I can as and when I have time. My trades are automated so I am not sat in front of a screen daily.
Jumping on random trade ideas 'willy-nilly' on Trading View trying to find that one trade that you can retire from is not a sustainable way to trade. You might get lucky, but it will always end one way.
------------------------------------------
Please hit the 👍 LIKE button if you like my ideas🙏
Also follow my profile, then you will receive a notification whenever I post a trading idea - so you don't miss them. 🙌
No one likes missing out, do they?
Also, see my 'related ideas' below to see more just like this.
The stats for this pair are shown below too.
Thank you.
Darren

US30Rules:
-If price break Point 2, 4, or 6 cancel the setup
-Price needs to break Point 1, 3, and 5 to confirm the setup
When price reach the 100FE it normally does a pullback or reversal
The market can Truncate

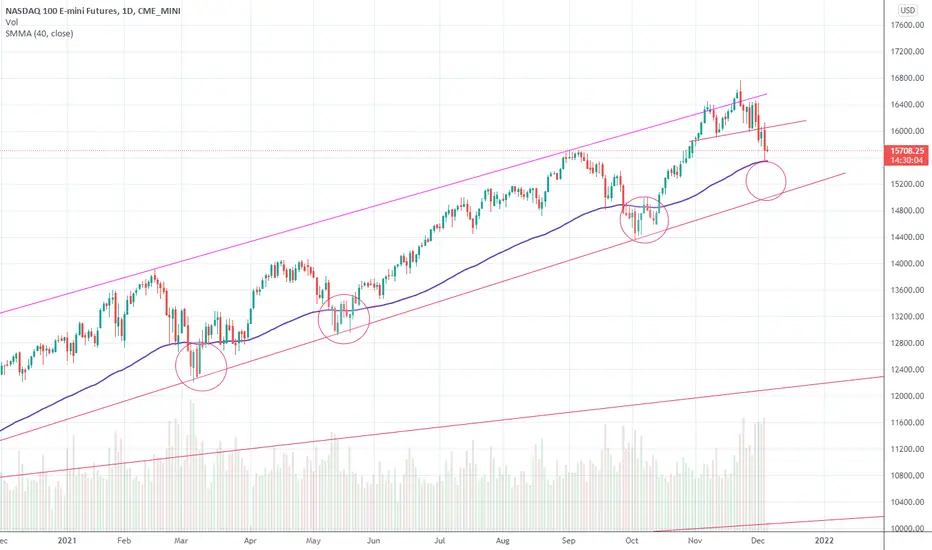
$NQ1! Channel formingA channel is forming on the Nasdaq, and it's not up. We need to see if support holds, but this weakness could potentially last longer than most might think. Caution on the long side.

UK100 long is valid ↗️✅Morning traders we start the week with an UK100 trade.
Trade details for current trade are shown on the chart.
Trade has been live since 7:15 UK time and we are using our POW reversal script.
We are working the 15M time frame on this strategy.
We're looking for the green line which is take profit target.
Little blue long arrow is entry point and purple line is stop loss.
Previous trades can also be seen on chart.
Trade history can be seen at the foot of this trade idea too for full transparency.
------------------------------------------
I try and share as many ideas as I can as and when I have time. My trades are automated so I am not sat in front of a screen daily.
Jumping on random trade ideas 'willy-nilly' on Trading View trying to find that one trade that you can retire from is not a sustainable way to trade. You might get lucky, but it will always end one way.
------------------------------------------
Please hit the 👍 LIKE button if you like my ideas🙏
Also follow my profile, then you will receive a notification whenever I post a trading idea - so you don't miss them. 🙌
No one likes missing out, do they?
Also, see my 'related ideas' below to see more just like this.
The stats for this pair are shown below too.
Thank you.
Darren

@LAL_PIPS US30 ANALYSISLast week price broke its respected resistance level (34900) and seems to be in an upward trend this week heading back to the reoccurring resistance area of 35400-35500. Last time we saw market price at those levels was on september 7th 2021.

NASDAQtech stocks are very volatile. NFP and UPr created some havoc in the us indexes but led to an overall bearish session. Support has been found in this so be ready for bullish action early next week.

new page this current page will no longer be in use as i have made a new page with a new name
Solarfx4
Fee free to check it out and give it a follow. would be much appreciated.
Thanks guys
SolarFX

I'm in a UK100 short 📉🙌Trade details for current trade are shown on the chart.
We are working the 15M time frame on this strategy.
Trade has been live since 2:45 UK time.
We're looking for the green line which is take profit target.
Little red short arrow is entry point and purple line is stop loss.
Previous trades can also be seen on chart.
Both were long trades one hit SL and one hit TP.
This trade is in slight draw down at time of writing but I trust my plan so lets see how this trade plays out.
Trade history can be seen at the foot of this trade idea too for full transparency.
In that box every trade is logged and can be viewed by clicking the tabs in the report box.
You as the viewer of this idea can also do that so go ahead and have a play.
I'll follow this trade now until TP is achieved, a new trade presents or stop loss is hit.
------------------------------------------
I try and share as many ideas as I can as and when I have time. My trades are automated so I am not sat in front of a screen daily.
Jumping on random trade ideas 'willy-nilly' on Trading View trying to find that one trade that you can retire from is not a sustainable way to trade. You might get lucky, but it will always end one way.
------------------------------------------
Please hit the 👍 LIKE button if you like my ideas🙏
Also follow my profile, then you will receive a notification whenever I post a trading idea - so you don't miss them. 🙌
No one likes missing out, do they?
Also, see my 'related ideas' below to see more just like this.
The stats for this pair are shown below too.
Thank you.
Darren

Nas100 Long After a long bearish run nasdaq has reached a strong daily support and can potentially prepare for a trip to a new all time high

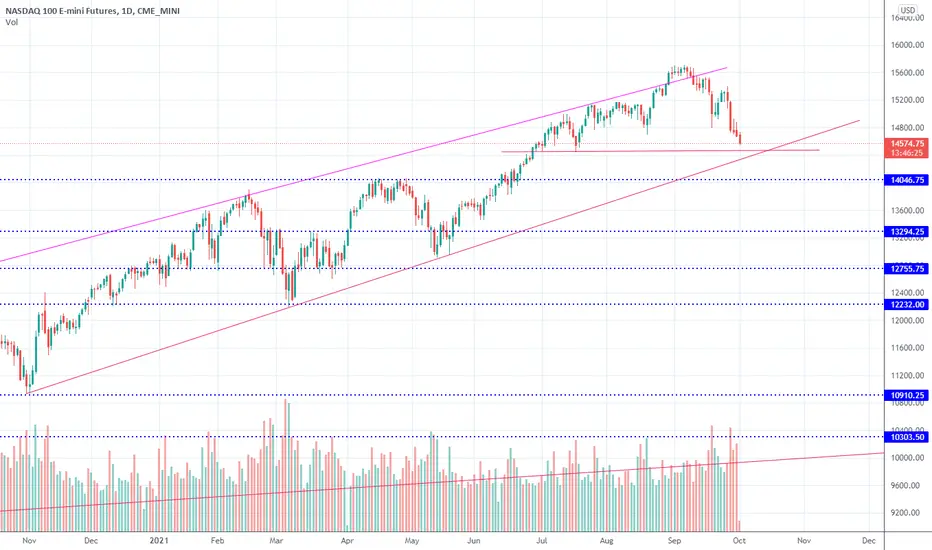
$NQ1! Nasdaq Futures. Some support coming upSome support expected between 14450 -14370. Could see a bounce off those levels, but some caution is advice as October historically has a tendency to be a volatile month in stock markets.
UK100 long is valid Trade details for current trade are shown on the chart.
We are working the 15M time frame on this strategy.
We're looking for the green line which is take profit target.
Little blue long arrow is entry point and purple line is stop loss.
Trade history can be seen at the foot of this trade idea too for full transparency.
Previous two trades can also be seen on chart.
------------------------------------------
I try and share as many ideas as I can as and when I have time. My trades are automated so I am not sat in front of a screen daily.
Jumping on random trade ideas 'willy-nilly' on Trading View trying to find that one trade that you can retire from is not a sustainable way to trade. You might get lucky, but it will always end one way.
------------------------------------------
Please hit the 👍 LIKE button if you like my ideas🙏
Also follow my profile, then you will receive a notification whenever I post a trading idea - so you don't miss them. 🙌
No one likes missing out, do they?
Also, see my 'related ideas' below to see more just like this.
The stats for this pair are shown below too.
Thank you.
Darren

SPX500 PitchforkKey pitchfork for current trend, sitting between the median line & 61.8% retrace, and the 50 DMA & 50% retrace

spx500 re entry spx 500 is giving us an other chance to enter its rally up. Entry was found in the 5 minutes its a 1 to 8 risk/reward ratio to the 5 minute high, i would personaly try to ride this to the all time high

$NQ1! Nasdaq Futures. Back into rising wedgeAdding a little $SQQ to "once again" hedge my portfolio against some downside risk. This strategy has not paid any dividends lately, but it's still worth while doing this for some downside protection. A breakout of the rising wedge will also stop me out.